

Circulating osteogenic precursor cells in type 2 diabetes mellitus
- PMID: 22740707
- PMCID: PMC3431571
- DOI: 10.1210/jc.2012-1546
Circulating osteogenic precursor cells in type 2 diabetes mellitus
Abstract
Context: Type 2 diabetes mellitus (T2D) is associated with an increased risk of fractures and low bone formation. However, the mechanism for the low bone formation is not well understood. Recently, circulating osteogenic precursor (COP) cells, which contribute to bone formation, have been characterized in the peripheral circulation.
Objective: Our objective was to characterize the number and maturity of COP cells in T2D.
Patients, design, and setting: Eighteen postmenopausal women with T2D and 27 controls participated in this cross-sectional study at a clinical research center.
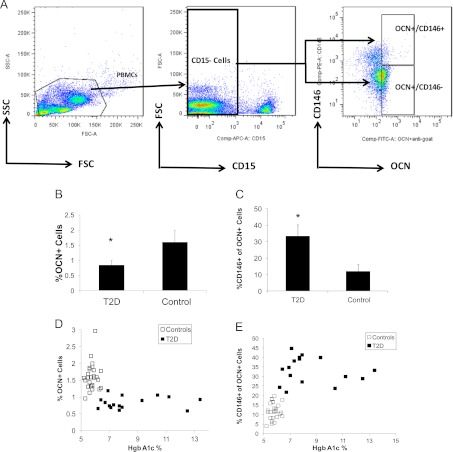
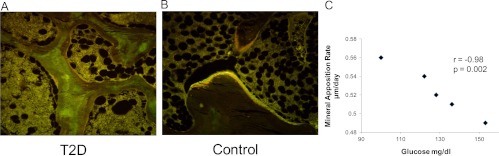
Main outcome measures: COP cells were characterized using flow cytometry and antibodies against osteocalcin (OCN) and early stem cell markers. Histomorphometric (n = 9) and molecular (n=14) indices of bone turnover and oxidative stress were also measured.
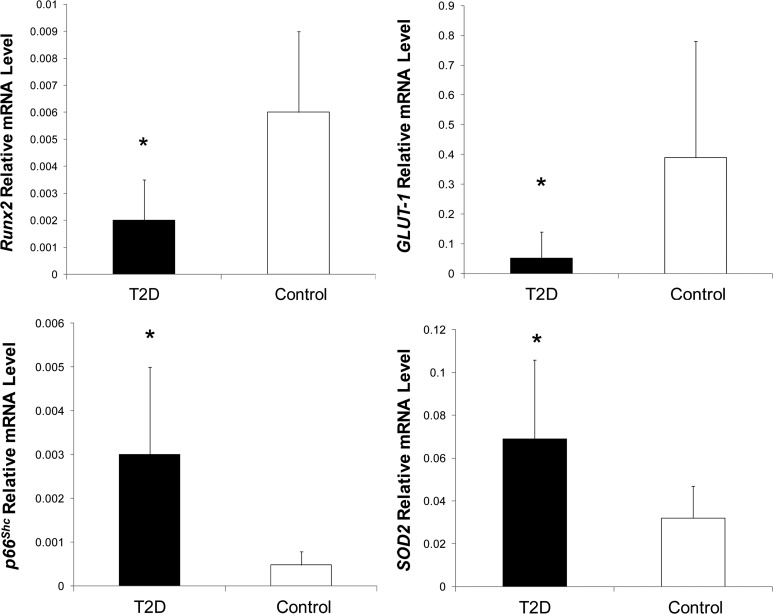
Results: The percentage of OCN(+) cells in peripheral blood mononuclear cells was lower in T2D (0.8 ± 0.2 vs. 1.6 ± 0.4%; P < 0.0001), whereas the percentage of OCN(+) cells coexpressing the early marker CD146 was increased (OCN(+)/CD146(+): 33.3 ± 7 vs. 12.0 ± 4%; P < 0.0001). Reduced histomorphometric indices of bone formation were observed in T2D subjects, including mineralizing surface (2.65 ± 1.9 vs. 7.58 ± 2.4%, P = 0.02), bone formation rate (0.01 ± 0.1 vs. 0.05 ±0.2 μm(3)/um(2) · d, P = 0.02), and osteoblast surface (1.23 ±0.9 vs. 4.60 ± 2.5%, P = 0.03). T2D subjects also had reduced molecular expression of the osteoblast regulator gene Runx2 but increased expression of the oxidative stress markers p66(Shc) and SOD2.
Conclusions: Circulating OCN(+) cells were decreased in T2D, whereas OCN(+)/CD146(+) cells were increased. Histomorphometric indices of bone formation were decreased in T2D, as was molecular expression of osteoblastic activity. Stimulation of bone formation may have beneficial therapeutic skeletal consequences in T2D.
Figures
References
-
- Bonds DE, Larson JC, Schwartz AV, Strotmeyer ES, Robbins J, Rodriguez BL, Johnson KC, Margolis KL. 2006. Risk of fracture in women with type 2 diabetes: the Women's Health Initiative Observational Study. J Clin Endocrinol Metab 91:3404–3410 - PubMed
-
- Lipscombe LL, Jamal SA, Booth GL, Hawker GA. 2007. The risk of hip fractures in older individuals with diabetes: a population-based study. Diabetes Care 30:835–841 - PubMed
-
- Janghorbani M, Van Dam RM, Willett WC, Hu FB. 2007. Systematic review of type 1 and type 2 diabetes mellitus and risk of fracture. Am J Epidemiol 166:495–505 - PubMed
-
- Schwartz AV, Sellmeyer DE, Ensrud KE, Cauley JA, Tabor HK, Schreiner PJ, Jamal SA, Black DM, Cummings SR. 2001. Older women with diabetes have an increased risk of fracture: a prospective study. J Clin Endocrinol Metab 86:32–38 - PubMed
-
- Tuominen JT, Impivaara O, Puukka P, Rönnemaa T. 1999. Bone mineral density in patients with type 1 and type 2 diabetes. Diabetes Care 22:1196–1200 - PubMed
Publication types
MeSH terms
Substances
LinkOut - more resources
Full Text Sources
Other Literature Sources
Medical
Miscellaneous
