A Prominin-1-Rich Pediatric Glioblastoma: Biologic Behavior Is Determined by Oxygen Tension-Modulated CD133 Expression but Not Accompanied by Underlying Molecular Profiles
- PMID: 22741033
- PMCID: PMC3384268
- DOI: 10.1593/tlo.11337
A Prominin-1-Rich Pediatric Glioblastoma: Biologic Behavior Is Determined by Oxygen Tension-Modulated CD133 Expression but Not Accompanied by Underlying Molecular Profiles
Abstract
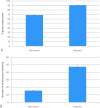
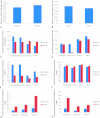
Few studies on the biologic and molecular properties of pediatric glioblastoma have been performed. Until now, differential genomic analysis of CD133(+)ve and CD133(-)ve fractions has not been described in pediatric glioma. We hypothesize not only that the presence of CD133 could be the source of tumor resistance but also that maintenance of this molecule by hypoxia dictates cellular and molecular behavior. From a series of human glioblastoma biopsies investigated, only one, IN699 (from a pediatric glioblastoma), generated greater than 4% of the total cell volume as CD133(+)ve cells. Using this pediatric glioblastoma, containing unprecedented high levels of the putative brain tumor stem cell marker CD133, as a study model, we report biologic and molecular characteristics of the parent culture and of CD133(+)ve and CD133(-)ve populations derived therefrom under atmospheric and hypoxic culture conditions. Immunocytochemistry and flow cytometry were performed with antigenic markers known to characterize neural stem cells and associated glioma behavior. Behavioral analysis was carried out using proliferation, adhesion, migration, and invasion assays. Cell cycle analysis and array comparative genomic hybridization were used to assess copy number profiles for parental cells and CD133(+)ve and CD133(-)ve fractions, respectively. With regard to invasion and proliferation, CD133(+)ve and CD133(-)ve fractions were inversely proportional, with a significant increase in invasive propensity within the CD133(-)ve cells (P < .005) and a significant increase in proliferation within CD133(+)ve cells (P < .005). Our observations indicate identical genomic imbalances between CD133(+)ve and CD133(-)ve fractions. Furthermore, our research documents a direct link between decreasing oxygen tension and CD133 expression.
Figures


Similar articles
-
CD133: holy of grail of neuro-oncology or promiscuous red-herring?Cell Prolif. 2012 Dec;45(6):527-37. doi: 10.1111/j.1365-2184.2012.00842.x. Cell Prolif. 2012. PMID: 23106300 Free PMC article. Review.
-
CD133 glycosylation is enhanced by hypoxia in cultured glioma stem cells.Int J Oncol. 2013 Mar;42(3):1011-7. doi: 10.3892/ijo.2013.1787. Epub 2013 Jan 22. Int J Oncol. 2013. PMID: 23340741
-
Uncoupling Warburg effect and stemness in CD133+ve cancer stem cells from Saos-2 (osteosarcoma) cell line under hypoxia.Mol Biol Rep. 2018 Dec;45(6):1653-1662. doi: 10.1007/s11033-018-4309-2. Epub 2018 Aug 20. Mol Biol Rep. 2018. PMID: 30128626
-
Molecular analysis of ex-vivo CD133+ GBM cells revealed a common invasive and angiogenic profile but different proliferative signatures among high grade gliomas.BMC Cancer. 2010 Aug 24;10:454. doi: 10.1186/1471-2407-10-454. BMC Cancer. 2010. PMID: 20735813 Free PMC article.
-
Sox2, a stemness gene, regulates tumor-initiating and drug-resistant properties in CD133-positive glioblastoma stem cells.J Chin Med Assoc. 2016 Oct;79(10):538-45. doi: 10.1016/j.jcma.2016.03.010. Epub 2016 Aug 13. J Chin Med Assoc. 2016. PMID: 27530866
Cited by
-
CD133: holy of grail of neuro-oncology or promiscuous red-herring?Cell Prolif. 2012 Dec;45(6):527-37. doi: 10.1111/j.1365-2184.2012.00842.x. Cell Prolif. 2012. PMID: 23106300 Free PMC article. Review.
-
CD133: to be or not to be, is this the real question?Am J Transl Res. 2013 Sep 25;5(6):563-81. Am J Transl Res. 2013. PMID: 24093054 Free PMC article. Review.
-
Pediatric glioma stem cells: biologic strategies for oncolytic HSV virotherapy.Front Oncol. 2013 Feb 28;3:28. doi: 10.3389/fonc.2013.00028. eCollection 2013. Front Oncol. 2013. PMID: 23450706 Free PMC article.
-
Voting-based cancer module identification by combining topological and data-driven properties.PLoS One. 2013 Aug 5;8(8):e70498. doi: 10.1371/journal.pone.0070498. Print 2013. PLoS One. 2013. PMID: 23940583 Free PMC article.
-
Hypoxia Inducible Factors' Signaling in Pediatric High-Grade Gliomas: Role, Modelization and Innovative Targeted Approaches.Cancers (Basel). 2020 Apr 15;12(4):979. doi: 10.3390/cancers12040979. Cancers (Basel). 2020. PMID: 32326644 Free PMC article. Review.
References
-
- Brustle O, McKay RD. The neuroepithelial stem cell concept: implications for neuro-oncology. J Neurooncol. 1995;24(1):57–59. - PubMed
-
- Valtz NL, Hayes TE, Norregaard T, Liu SM, McKay RD. An embryonic origin for medulloblastoma. New Biol. 1991;3(4):364–371. - PubMed
-
- Wechsler-Reya R, Scott MP. The development biology of brain tumours. Annu Rev Neurosci. 2001;24:385–428. - PubMed
LinkOut - more resources
Full Text Sources
Research Materials
