. 2012 Jun 1;3(6):1266-73.
doi: 10.1364/BOE.3.001266. Epub 2012 May 4.

Light-induced Ca(2+) transients observed in widefield epi-fluorescence microscopy of excitable cells

Affiliations

Light-induced Ca(2+) transients observed in widefield epi-fluorescence microscopy of excitable cells

Alison McDonald et al. Biomed Opt Express. .

Abstract

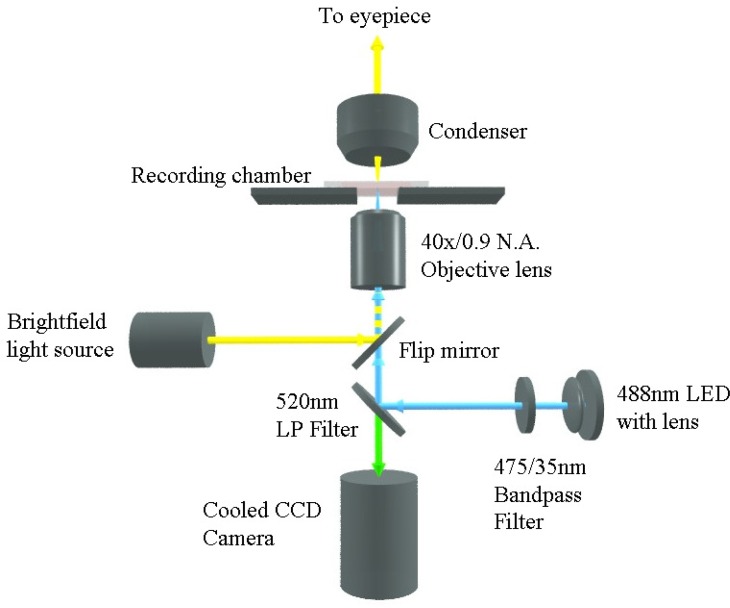
We have investigated the possibility that variations in the level of intracellular Ca(2+) in excitable cells might be induced as an artifact of the incoherent illumination that is being used to monitor transient responses. In order to avoid the fluctuations in power of an arc lamp source, a microscope using a light emitting diode that was calibrated accurately at low power levels, was constructed to provide good control over the dose of light applied to the biological specimen. We report here that higher powers of illumination increased the probability of occurrence of Ca(2+) transients even in the sub-mW range normally used to measure such transients in epi-fluorescence work, suggesting that caution should be exercised when designing experiments and interpreting data.

Keywords: (170.0110) Imaging systems; (170.2520) Fluorescence microscopy; (170.3880) Medical and biological imaging; (170.5380) Physiology.


Figures

Fig. 1
Fig. 1
Schematic of widefield epi-fluorescence and brightfield transmission microscope system. Brightfield transmission was collected by the condenser lens and viewed through the eyepiece. White light illumination from the lamp was computer controlled via a flip mirror. The 488 nm LED excitation source was lensed and filtered externally from the inverted microscope to uniformly fill the field of view. Fluorescence was detected using a highly sensitive fast CCD camera with a 520nm LP filter in the detection path.
Fig. 2
Fig. 2
The number of cells exhibiting Ca2+ responses for n = 30 cells are shown for each optical power setting. The responses are categorized as global or localized response. The data is expressed with a 5% error in detection for optical power.
Fig. 3
Fig. 3
(a) Extracted frames from a movie of an isolated smooth muscle cell with 150 μW of 488 nm irradiation. The progression of a localized Ca2+ transient is shown at time points i) 14.5 seconds, ii) 16.4 seconds, iii) 17.2 seconds and iv) 20.8 seconds. The region of interest is indicated by the broken circle. (b) Extracted frames of the same cell shown in (a) at a later time point. The progression of a global Ca2+ transient is shown over the following time points i) 35.6 seconds, ii) 35.9 seconds, iii) 36.8 seconds and iv) 50.1 seconds. (c) Corresponding fluorescence signal intensity profiles over the course of the acquisition period shown in (a) (b). 3(c)i shows the intensity in the region circled in (a) over time, and 3(c)ii shows the intensity of the full cell over time. Ca2+ images (a) and (b), are taken from the time points indicated in (ci) and (cii), respectively.
Fig. 4
Fig. 4
A global Ca2+ transient was observed after a step-wise increase in optical power (Media 1). The specimen was initially irradiated from t = 0-80 seconds at 30μW (not shown). The 30 μW irradiation continued from t = 80 seconds until t = 164 seconds, when the average power was increased to 70 μW. The specimen was illuminated from t = 164 seconds to t = 271.2 seconds, and then the power was incremented to 110 μW for the remainder of the experiment. A global Ca2+ transient is observed with illumination of 110 μW average power at t = 307.6 seconds. The selected frame shows the recovered cell at t = 400.00 seconds. The cross and ‘1’ indicates a highlighted single point from which the fluorescence intensity over time data was plotted.
Fig. 5
Fig. 5
A global Ca2+ rise resulting in contraction of a single smooth muscle cell under epi-fluorescence excitation. Frames show (a) an unresponsive cell under 70 μW illumination at t = 309.10 seconds, (b) a global Ca2+ rise under 110 μW illumination at t = 318.40 seconds, (c) subsequent cell contraction at t = 322.90 seconds followed by (d) recovery at t = 381.40 seconds. The cross (+) and ‘1’ indicates a highlighted single point from which it was possible to plot fluorescence intensity over time data (not shown).

Similar articles

Cited by

References

    1. Shaner N. C., Steinbach P. A., Tsien R. Y., “A guide to choosing fluorescent proteins,” Nat. Methods 2(12), 905–909 (2005).10.1038/nmeth819 - DOI - PubMed
    1. Zhang J., Campbell R. E., Ting A. Y., Tsien R. Y., “Creating new fluorescent probes for cell biology,” Nat. Rev. Mol. Cell Biol. 3(12), 906–918 (2002).10.1038/nrm976 - DOI - PubMed
    1. Cole R. W., Turner J. N., “Light-emitting diodes are better illumination sources for biological microscopy than conventional sources,” Microsc. Microanal. 14(03), 243–250 (2008).10.1017/S1431927608080288 - DOI - PubMed
    1. Albeanu D. F., Soucy E., Sato T. F., Meister M., Murthy V. N., “LED arrays as cost effective and efficient light sources for widefield microscopy,” PLoS ONE 3(5), e2146 (2008).10.1371/journal.pone.0002146 - DOI - PMC - PubMed
    1. Ntziachristos V., “Going deeper than microscopy: the optical imaging frontier in biology,” Nat. Methods 7(8), 603–614 (2010).10.1038/nmeth.1483 - DOI - PubMed

LinkOut - more resources