. 2012 Jul 25;134(29):12016-27.
doi: 10.1021/ja3009693. Epub 2012 Jul 17.

Chemical characterization of the smallest S-nitrosothiol, HSNO; cellular cross-talk of H2S and S-nitrosothiols

Affiliations
Free PMC article

Chemical characterization of the smallest S-nitrosothiol, HSNO; cellular cross-talk of H2S and S-nitrosothiols

Milos R Filipovic et al. J Am Chem Soc. .
Free PMC article

Abstract

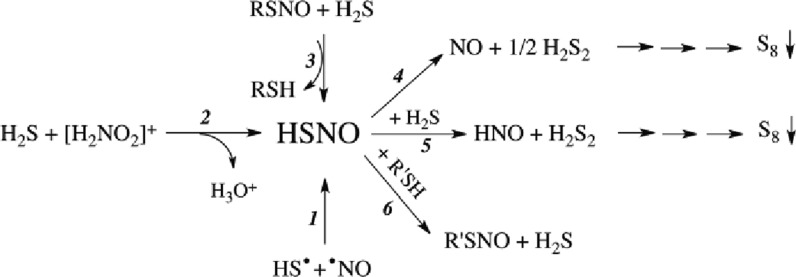
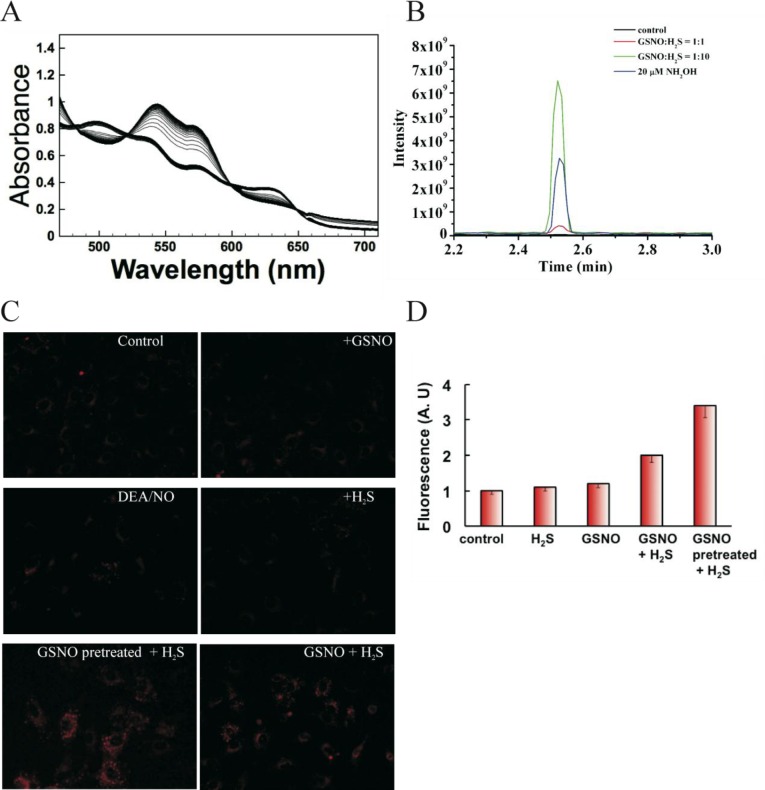
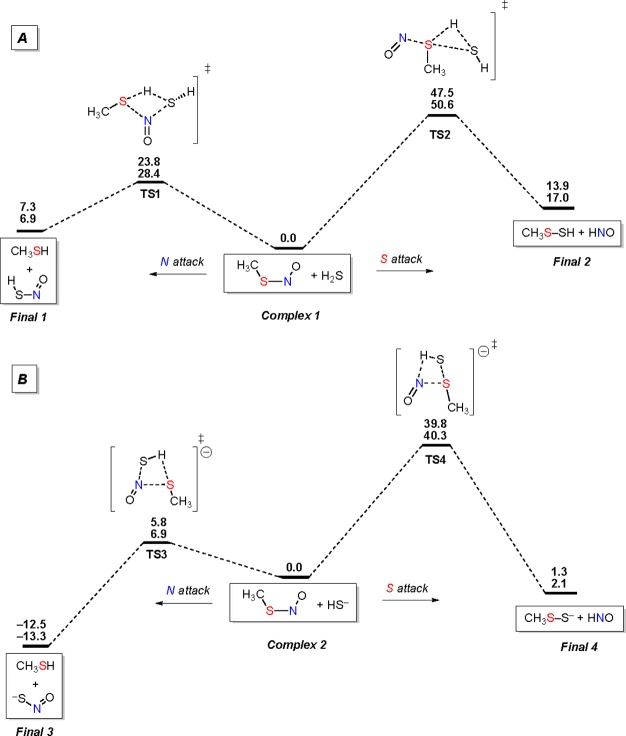
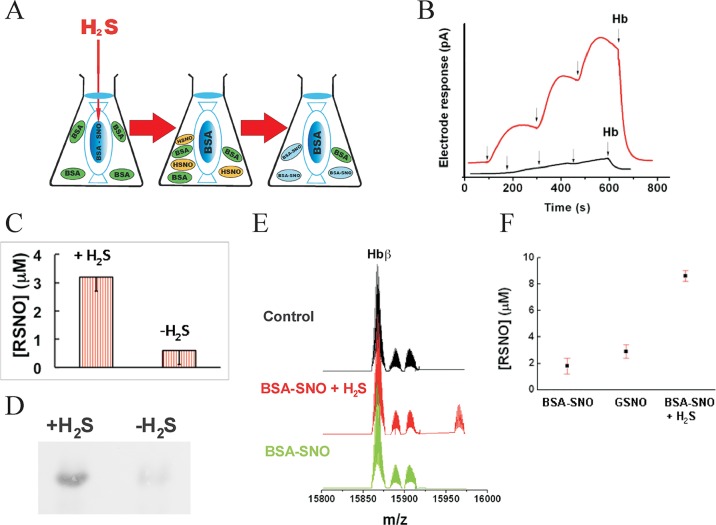
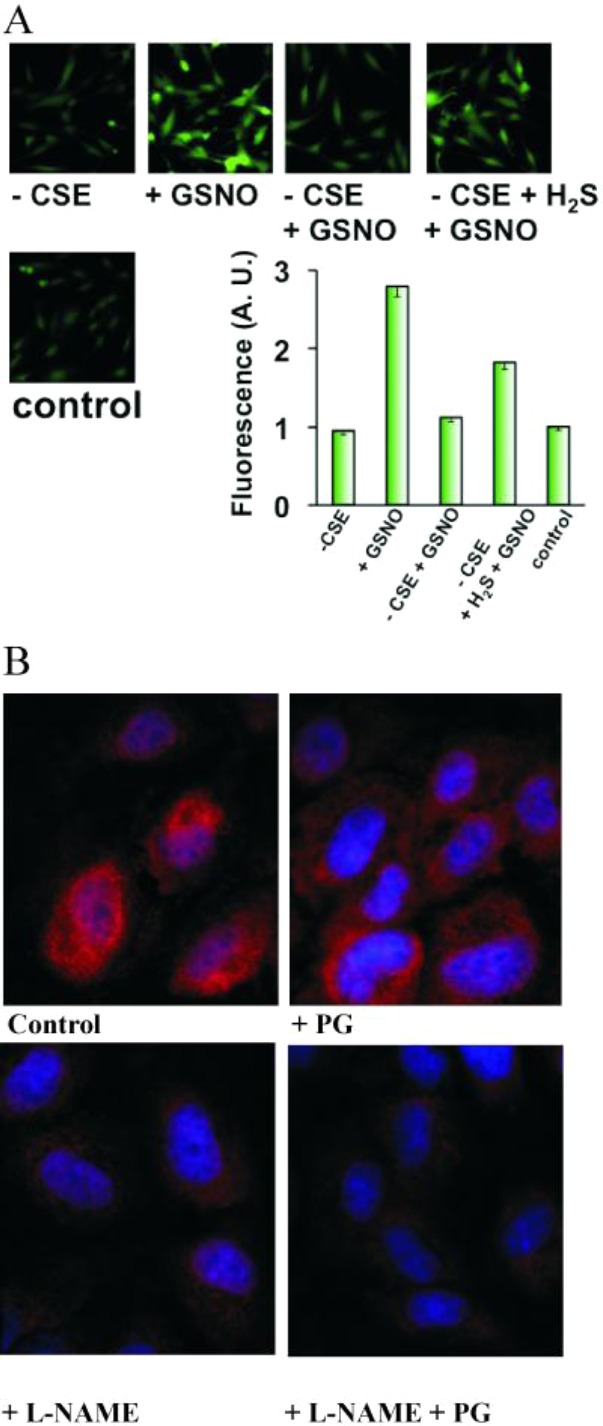
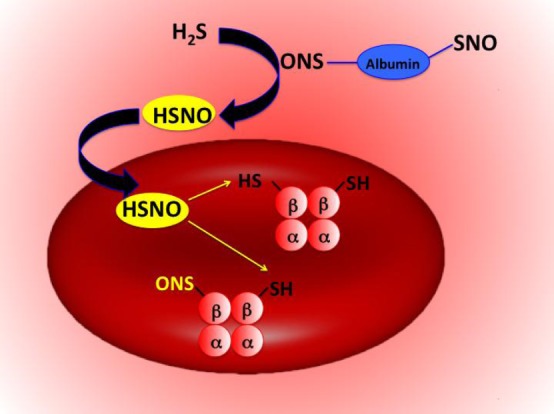
Dihydrogen sulfide recently emerged as a biological signaling molecule with important physiological roles and significant pharmacological potential. Chemically plausible explanations for its mechanisms of action have remained elusive, however. Here, we report that H(2)S reacts with S-nitrosothiols to form thionitrous acid (HSNO), the smallest S-nitrosothiol. These results demonstrate that, at the cellular level, HSNO can be metabolized to afford NO(+), NO, and NO(-) species, all of which have distinct physiological consequences of their own. We further show that HSNO can freely diffuse through membranes, facilitating transnitrosation of proteins such as hemoglobin. The data presented in this study explain some of the physiological effects ascribed to H(2)S, but, more broadly, introduce a new signaling molecule, HSNO, and suggest that it may play a key role in cellular redox regulation.


Figures

Scheme 1
Scheme 1. HSNO Generation (Eqs 1–3) and Reactivity (Eqs 4–6)
Figure 1
Figure 1
Generation of HSNO/SNO by pulse radiolysis in argon-saturated water pH 11. (A) Time-resolved absorbance spectral investigation of HSNO/SNO generated by pulse radiolysis. The spectra reveal formation of a peak at 370 nm consisting of HSSH•–/HSS•2– and HSNO/SNO. (B) The actual spectrum of generated HSNO/SNO, obtained by subtracting the first spectrum from that acquired after 5 μs.
Figure 2
Figure 2
Mass spectrum of HSNO, that is, [HSNO + H+]+, prepared by acidification of nitrite in the presence of sulfide and then neutralized with the 300 mM potassium phosphate pH 7.4 buffer.
Figure 3
Figure 3
Characterization of HSNO/SNO generated by transnitrosation of S-nitrosoglutathione (GSNO) and H2S. (A) ESI-TOF-MS spectrum of HSNO generated in transnitrosation reaction between GSNO and H2S. Experimental (black) and theoretical (red) isotope distribution of the detected m/z 64 peak of [HSNO + H]+. (B) Real-time FTIR confirms formation of a new nitrosothiol product. Differential IR spectrum of the reaction of 120 mM GSNO and 100 mM Na2S in 300 mM potassium phosphate buffer pH 7.4 (black, after 1 min; red, after 10 min). Inset: Spectral difference between 14N and 15N labeled HSNO/SNO. (C) 15N NMR spectrum of HSNO/SNO at pH 7.4. Black: Mixture of 15N-enriched GSNO with nitrite. Red: After addition of equimolar concentration (25 mM) of sulfide. Blue: After 1 h, only the nitrite signal remains. The reaction was performed in 300 mM potassium phosphate buffer, pH 7.4.
Figure 4
Figure 4
Kinetics of H2S consumption and NO generation in the reaction of GSNO with H2S. (A) Representative recordings by H2S (black) and NO (red) electrodes, illustrating two processes described by eqs 3 and 4. A 400 μM Na2S solution was prepared in 50 mM potassium phosphate buffer, pH 7.4. When the electrode response reached its maximum, an equimolar amount of GSNO was added, triggering an immediate drop in current at the H2S electrode and a rise in the NO signal. Kinetic traces of NO release (B) and H2S consumption (C) from the reaction mixture containing 250 μM GSNO and 250 μM H2S at pH 7.4 at 25 °C. Red lines represent a first-order fit for (B) and a second-order fit for (C).
Figure 5
Figure 5
Generation of HNO from HSNO in biological milieu. (A) Reductive nitrosylation as a proof of HNO formation. 100 μM GSNO and 200 μM Na2S solution were added to 50 μM metHb in 50 mM potassium phosphate buffer pH 7.4, and the reaction was followed every 10 s for a total of 5 min. Immediate formation of nitrosylhemoglobin is indicative of HNO. (B) GC–MS detection of hydroxylamine. A 60 μM GSNO solution was mixed, at different ratios indicated in the figure, with H2S at pH 7.4, and after 10 min the reaction mixture was treated with cyclopentanone and methanol. At 1 h after the incubation, the corresponding mixtures were analyzed by GC–MS (m/z 99 for cyclopentanone oxime). Buffer and a GSNO solution served as controls. (C) H2S and GSNO react in cells to yield HNO. Human umbilical vein endothelial cells, loaded with 10 μM CuBOT1, were treated with either 100 μM Na2S, 100 μM GSNO, or both for 20 min. Some cells were pretreated with 100 μM GSNO for 20 min to increase intracellular nitrosothiol content and then exposed to 100 μM Na2S. A 100 μM DEA/NONOate solution served as a negative control. (D) Fluorescence intensity was quantified using ImageJ, NIH (n = >30 cells).
Figure 6
Figure 6
B3LYP/aug-cc-pVTZ computed energy profile for the reaction between CH3SNO and H2S/HS. Energies are in kcal mol–1; E+ZPE (first entry), G (second entry).
Figure 7
Figure 7
HSNO serves as a shuttle for NO+. (A) Experimental design for the protein-to-protein trans-nitrosation mediated by HSNO (see Experimental Section). (B) S-Nitrosothiol content in the sample obtained from protein-to-protein transnitrosation experiment. NO electrode responses upon subsequent addition of aliquots of the control (black) or H2S-treated samples (red) into 500 μM ascorbate/Cu2+ containing solution. Upon addition of hemoglobin (Hb), all NO was scavenged. (C) Total amount of RSNOs generated by H2S in protein-to-protein transnitrosation experiment (n = 4). (D) The results of the biotin switch assay for the same samples. (E,F) HSNO facilitated nitrosation of hemoglobin in human red blood cells. Deconvoluted mass spectra (E) of hemoglobin beta subunit isolated from RBC after the treatment with synthetic poly-S-nitrosoalbumin (BSA-SNO) in the presence or absence of H2S. Sample treated with poly-S-nitrosoalbumin in the presence of H2S exhibit another peak shifted by mass of 58 corresponding to [Hb – 2H + NO + K]+. S-Nitroso hemoglobin content (F) determined using Saville’s method. Hemoglobin concentration in all samples was 650 μM.
Figure 8
Figure 8
Endogenous H2S controls transnitrosation and S-nitrosothiol formation. (A) H2S-dependent GSNO-induced transnitrosation of DAF. HUVECs were incubated for 2 h in medium with or without CSE-inhibitor propargylglycine (1 mM). Cells were then exposed to 50 μM GSNO. Some cells were additionally incubated with 100 μM Na2S for 20 min prior to GSNO addition. NO-induced fluorescence was detected by fluorescence microscopy and quantified using ImageJ (n = 20–30 cells). (B) The effect of inhibitors of endogenous NO and H2S production on intracellular S-nitrosation. HUVECs were exposed to medium supplemented without or with 1 mM L-NAME, 1 mM PG, or both for 2 h. Cells were fixed and intracellular RSNOs visualized by immunocytochemistry using anti-S-nitrosocysteine antibodies.
Figure 9
Figure 9
Proposed reaction scheme for HSNO-induced nitrosation of hemoglobin.

Similar articles

Cited by

References

    1. Koppenol W. H. Free Radical Biol. Med. 1998, 25, 385–391. - PubMed
    2. Ford P. C.; Lorkovic I. Chem. Rev. 2002, 102, 993–1018. - PubMed
    3. McCleverty J. A. Chem. Rev. 2002, 102, 403–418. - PubMed
    4. Tennyson A. G.; Lippard S. J. Chem. Biol. 2011, 18, 1211–1220. - PubMed
    5. Stamler J. S.; Singel D. J.; Loscalzo J. Science 1992, 258, 1898–1902. - PubMed
    6. Moncada S.; Palmer R. M. J.; Higgs E. A. Pharmacol. Rev. 1991, 43, 109–142. - PubMed
    7. Calabrese V.; Cornelius C.; Rizzarelli E.; Owen J. B.; Dinkova-Kostova A. T.; Butterfield D. A. Antioxid. Redox Signaling 2009, 11, 2717–2739. - PubMed
    8. Palmer R. M. J.; Ferrige A. G.; Moncada S. Nature 1987, 327, 524–526. - PubMed
    1. Yang G.; Wu L.; Jiang B.; Yang W.; Qi J.; Cao K.; Meng Q.; Mustafa A. K.; Mu W.; Zhang S.; Snyder S. H.; Wang R. Science 2008, 322, 587–590. - PMC - PubMed
    1. Li L.; Rose P.; Moore P. K. Annu. Rev. Pharmacol. Toxicol. 2011, 51, 169–187. - PubMed
    2. Kabil O.; Banerjee R. J. Biol. Chem. 2010, 285, 21903–21907. - PMC - PubMed
    3. Li L.; Hsu A.; Moore P. K. Pharmacol. Ther. 2009, 123, 386–400. - PubMed
    1. Whiteman M.; Li L.; Kostetski I.; Chu S. H.; Siau J. L.; Bhatia M.; Moore P. K. Biochem. Biophys. Res. Commun. 2006, 343, 303–310. - PubMed
    2. Yong Q. C.; Hu L. F.; Wang S.; Huang D.; Bian J. S. Cardiovasc. Res. 2010, 88, 482–491. - PubMed
    3. Ondrias K.; Stasko A.; Cacanyiova S.; Sulova Z.; Krizanova O.; Kristek F.; Malekova L.; Knezl V.; Breier A. Pfluegers Arch. 2008, 457, 271–279. - PubMed
    4. Sojitra B.; Bulani Y.; Putcha U. K.; Kanwal A.; Gupta P.; Kuncha M.; Banerjee S. K. Mol. Cell. Biochem. 2012, 60, 61–69. - PubMed
    5. Bertova A.; Cacanyiova S.; Kristek F.; Krizanova O.; Ondrias K.; Tomaskova Z. Gen. Physiol. Biophys. 2010, 29, 402–410. - PubMed
    1. Zhao W.; Wang R. Am. J. Physiol.: Heart Circ. Physiol. 2002, 283, H474–H480. - PubMed
    2. Mustafa A. K.; Sikka G.; Gazi S. K.; Steppan J.; Jung S. M.; Bhunia A. K.; Barodka V. M.; Gazi F. K.; Barrow R. K.; Wang R.; Amzel L. M.; Berkowitz D. E.; Snyder S. H. Circ. Res. 2011, 109, 1259–1268. - PMC - PubMed

Publication types