. 2012 Jul;26 Suppl 1(0 1):239-58.
doi: 10.1111/j.1365-3016.2012.01285.x.

Impact of increasing inter-pregnancy interval on maternal and infant health

Affiliations

Impact of increasing inter-pregnancy interval on maternal and infant health

Amanda Wendt et al. Paediatr Perinat Epidemiol. 2012 Jul.

Abstract

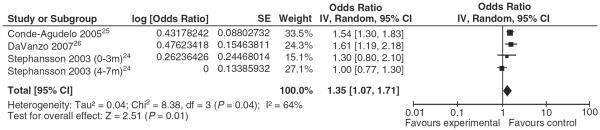
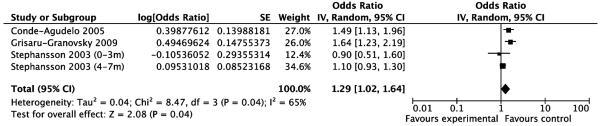
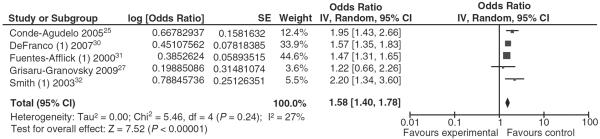
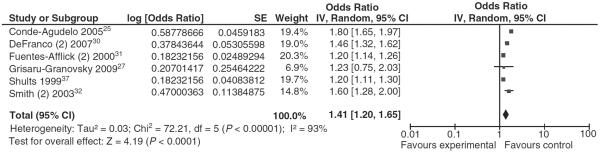
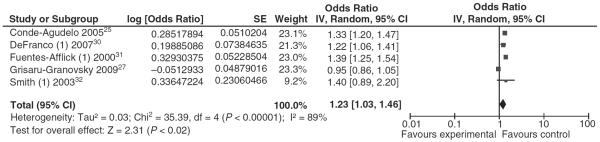
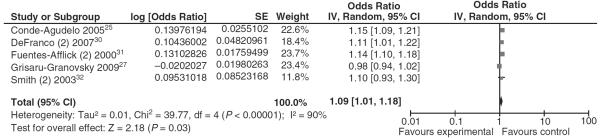
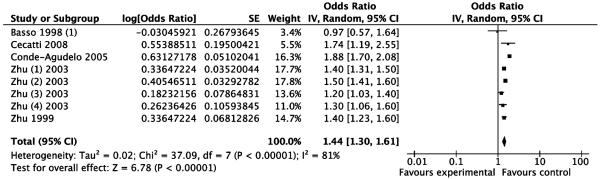
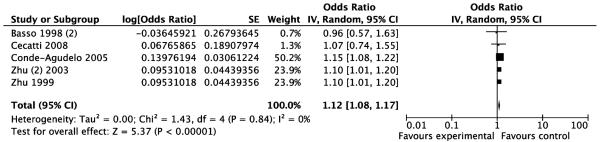
Short inter-pregnancy intervals (IPIs) have been associated with adverse maternal and infant health outcomes in the literature. However, many studies in this area have been lacking in quality and appropriate control for confounders known to be associated with both short IPIs and poor outcomes. The objective of this systematic review was to assess this relationship using more rigorous criteria, based on GRADE (Grading of Recommendations Assessment, Development and Evaluation) methodology. We found too few higher-quality studies of the impact of IPIs (measured as the time between the birth of a previous child and conception of the next child) on maternal health to reach conclusions about maternal nutrition, morbidity or mortality. However, the evidence for infant effects justified meta-analyses. We found significant impacts of short IPIs for extreme preterm birth [<6 m adjusted odds ratio (aOR): 1.58 [95% confidence interval (CI) 1.40, 1.78], 6-11 m aOR: 1.23 [1.03, 1.46]], moderate preterm birth (<6 m aOR: 1.41 [1.20, 1.65], 6-11 m aOR: 1.09 [1.01, 1.18]), low birthweight (<6 m aOR: 1.44 [1.30, 1.61], 6-11 m aOR: 1.12 [1.08, 1.17]), stillbirth (aOR: 1.35 [1.07, 1.71] and early neonatal death (aOR: 1.29 [1.02, 1.64]) outcomes largely in high- and moderate-income countries. It is likely these effects would be greater in settings with poorer maternal health and nutrition. Future research in these settings is recommended. This is particularly important in developing countries, where often the pattern is to start childbearing at a young age, have all desired children quickly and then control fertility through permanent contraception, thereby contracting women's fertile years and potentially increasing their exposure to the ill effects of very short IPIs.


Figures

Figure 1
Figure 1
Forest plot for inter-pregnancy intervals (IPIs) (<7 months) and stillbirth. Included studies are listed, along with the IPI of exposed and unexposed groups and stillbirth definition: Conde-Agudelo et al. 2005 (<6 vs. 18–23 months) (stillbirth: birth of a foetus at 20 weeks of gestation or later, which shows no sign of life); Da Vanzo et al. 2007 (IPI: <6 vs. 27–50 months) (stillbirth: foetal loss at 28 weeks or more since last menstrual period after a livebirth); Stephansson et al. 2003 (IPI: 0–3 vs. 12–35 months and 4–7 vs. 12–35 months) (stillbirth: foetal loss at 28 weeks or more since last menstrual period after a livebirth). IV, inverse variance; CI, confidence interval.
Figure 2
Figure 2
Forest plot for inter-pregnancy intervals (IPIs) and early neonatal death. Included studies are listed, along with the IPI of exposed and unexposed groups and early neonatal death definition: Conde-Agudelo et al. 2005 (<6 vs. 18–23 months) (early neonatal death: death of a liveborn infant in the first week of life); Grisaru-Granovsky et al. 2009 (IPI: 0–5 vs. 12–23 months) (early neonatal death: death within 0–6 days after delivery); Stephansson et al. 2003 (IPI: 0–3 vs. 12–35 months and 4–7 vs. 12–35 months) (early neonatal death: death during the first week after delivery). IV, inverse variance; CI, confidence interval.
Figure 3
Figure 3
Forest plot for inter-pregnancy intervals (IPIs) (<6 months) and extreme preterm birth. Included studies are listed, along with the IPI of exposed and unexposed groups and preterm birth (PTB) definition: Conde-Agudelo et al. 2005 (<6 vs. 18–23 months) (PTB: <32 weeks); DeFranco et al. 2007 (<6 vs. >18 months) (PTB: 28–32 weeks); Fuentes-Afflick et al. 2000 (<6 vs. 18–59 months) (PTB: 23–32 weeks); Grisaru-Granovsky et al. 2009 (0–5 vs. 12–23 months) (PTB: <33 weeks); Smith et al. 2003 (1–5 vs. 18–23 months) (PTB: 24–32 weeks). IV, inverse variance; CI, confidence interval.
Figure 4
Figure 4
Forest plot for inter-pregnancy interval (IPIs) (<6 months) and all or moderate preterm birth. Included studies are listed, along with the IPI of exposed and unexposed groups and preterm birth (PTB) definition: Conde-Agudelo et al. 2005 (<6 vs. 18–23 months) (PTB: < 37 weeks); DeFranco et al. 2007 (<6 vs. >18 months) (PTB: 32–35 weeks); Fuentes-Afflick et al. 2000 (<6 vs. 18–59 months) (PTB: 33–37 weeks); Grisaru-Grovsky et al. 2009 (0–5 vs. 12–23 months) (PTB: <37 weeks); Shults et al. 1999 (0–3 vs. 13–24 months) (PTB: <37 weeks); Smith et al. 2003 (1–5 vs. 18–23 months) (PTB: 33–35 weeks). IV, inverse variance; CI, confidence interval.
Figure 5
Figure 5
Forest plot for inter-pregnancy interval (IPIs) (>6 months) and extreme preterm birth. Included studies are listed, along with the IPI of exposed and unexposed groups and preterm birth (PTB) definition: Conde-Agudelo et al. 2005 (6–11 vs. 18–23 months) (PTB: < 32 weeks); DeFranco et al. 2007 (6–12 vs. >18 months) (PTB: 28–32 weeks); Fuentes-Afflick et al. 2000 (6–11 vs. 18–59 months) (PTB: 23–32 weeks); Grisaru-Granovsky et al. 2009 (6–11 vs. 12–23 months) (PTB: <33 weeks); Smith et al. 2003 (6–11 vs. 18–23 months) (PTB: 24–32 weeks). IV, inverse variance; CI, confidence interval.
Figure 6
Figure 6
Forest plot for inter-pregnancy interval (IPIs) (>6 months) and all or moderate preterm birth. Included studies are below, along with the IPI of exposed and unexposed groups and preterm birth (PTB) definition: Conde-Agudelo et al. 2005 (6–11 vs. 18–23 months) (PTB: < 37 weeks); DeFranco et al. 2007 (6–12 vs. >18 months) (PTB: 32–35 weeks); Fuentes-Afflick et al. 2000 (6–11 vs. 18–59 months) (PTB: 33–37 weeks); Grisaru-Granovsky et al. 2009 (6–11 vs. 12–23 months) (PTB: <37 weeks); Smith et al. 2003 (6–11 vs. 18–23 months) (PTB: 33–35 weeks). IV, inverse variance; CI, confidence interval.
Figure 7
Figure 7
Forest plot for inter-pregnancy interval (IPIs) (<6 months) and low birthweight. Included studies are listed, along with the IPI of exposed and unexposed groups: Basso et al. 1998 (<4 vs. 24–36 months); Cecatti et al. 2008 (<4 vs. 18–23 months); Conde-Agudelo et al. 2005 (<6 vs. 18–23 months); Zhu et al. 2003 (<6 vs. 18–23 months); Zhu et al. 1999 (0–5 vs. 18–23 months). Numbers in parentheses in Zhu et al. 2003 refer to the birth pair of focus: (1) first–second birth pair, (2) second–third birth pair, (3) third–fourth birth pair, (4) fourth–fifth pair. IV, inverse variance; CI, confidence interval.
Figure 8
Figure 8
Forest plot for inter-pregnancy interval (IPIs) (>6 months) and low birthweight. Included studies are listed, along with the IPI of exposed and unexposed groups: Basso et al. 1998 (8–12 vs. 24–36 months); Cecatti et al. 2008 (6–11 vs. 18–23 months); Conde-Agudelo et al. 2005 (6–11 vs. 18–23 months); Zhu et al. 2003 (6–11 vs. 18–23 months); Zhu et al. 1999 (6–11 vs. 18–23 months). IV, inverse variance; CI, confidence interval.

References

    1. Hughes E. Children's Bureau Publication. US Children's Bureau; Washington, DC: 1923. Infant Mortality: Results of a Field Study in Gary, Indiana, Based on Births in One Year; p. 112.
    1. Woodbury R. Children's Bureau Publication. US Children's Bureau; Washington, DC: 1925. Causal Factors in Infant Mortality: a Statistical Study Based on Investigations in Eight Cities; p. 112.
    1. Eastman NJ. The effect of the interval between births on maternal and fetal outlook. American Journal of Obstetrics and Gynecology. 1944;47:445–466.
    1. Yerushalmy J. On the interval between successive births and its effect on the survival of the infant – I. An indirect method of study. Human Biology. 1945;17:65–106.
    1. Merchant K, Martorell R. Frequent reproductive cycling: does it lead to nutritional depletion of mothers? Progress in Food and Nutrition Science. 1988;12:339–369. - PubMed

Publication types