

The impact of early age at first childbirth on maternal and infant health
- PMID: 22742615
- PMCID: PMC4562289
- DOI: 10.1111/j.1365-3016.2012.01290.x
The impact of early age at first childbirth on maternal and infant health
Abstract
The objective of this review was to assess whether early age at first childbirth is associated with increased risk of poor pregnancy outcomes. Early age at childbirth is variously defined in studies of its effect on maternal and infant health. In this systematic review, we limit analysis to studies of at least moderate quality that examine first births among young mothers, where young maternal age is defined as low gynaecological age (≤ 2 years since menarche) or as a chronological age ≤ 16 years at conception or delivery. We conduct meta-analyses for specific maternal or infant health outcomes when there are at least three moderate quality studies that define the exposure and outcome in a similar manner and provide odds ratios or risk ratios as their effect estimates. We conclude that the overall evidence of effect for very young maternal age (<15 years or <2 years post-menarche) on infant outcomes is moderate; that is, future studies are likely to refine the estimate of effect or precision but not to change the conclusion. Evidence points to an impact of young maternal age on low birthweight and preterm birth, which may mediate other infant outcomes such as neonatal mortality. The evidence that young maternal age increases risk for maternal anaemia is also fairly strong, although information on other nutritional outcomes and maternal morbidity/mortality is less clear. Many of the differences observed among older teenagers with respect to infant outcomes may be because of socio-economic or behavioural differences, although these may vary by country/setting. Future, high quality observational studies in low income settings are recommended in order to address the question of generalisability of evidence. In particular, studies in low income countries need to consider low gynaecological age, rather than simply chronological age, as an exposure. As well, country-specific studies should measure the minimum age at which childbearing for teens has similar associations with health as childbearing for adults. This 'tipping point' may vary by the underlying physical and nutritional health of girls and young women.
© 2012 Blackwell Publishing Ltd.
Conflict of interest statement
The authors declare no conflicts of interest in connection with this work.
Figures
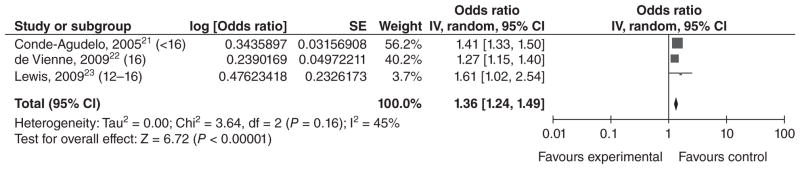
Conde-Agudelo et al., 2005 (<16 years vs. 20–24 years).
cde Vienne et al., 2009 (16 years vs. 20 years).
Lewis et al., 2009 (12–16 years vs. >19 years).
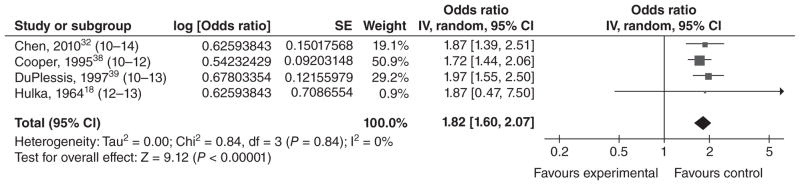
Chen et al., 2010 (10–14 years vs. 20–24 years).
dCooper et al., 1995 (10–12 years vs. 15 years).
DuPlessis et al., 1997 (10–13 years vs. 20–24 years).
Hulka et al., 1964 (12–13 years vs. 19–21 years).
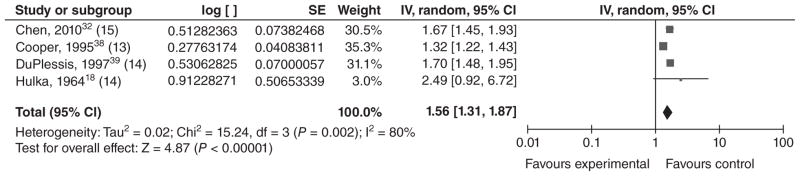
Chen et al., 2010 (15 years vs. 20–24 years).
dCooper et al., 1995 (13 years vs. 15 years).
DuPlessis et al., 1997 (14 years vs. 20–24 years).
Hulka et al., 1964 (14 years vs. 19–21 years).
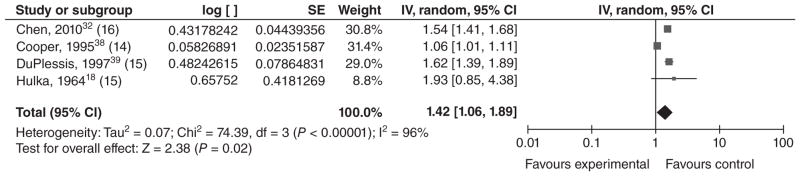
Chen et al., 2010 (16 years vs. 20–24 years).
dCooper et al., 1995 (14 years vs. 15 years).
DuPlessis et al., 1997 (15 years vs. 20–24 years).
Hulka et al., 1964 (15 years vs. 19–21 years).
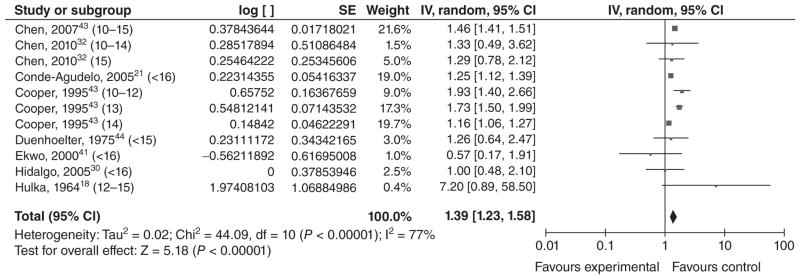
cChen et al., 2007 (10–15 years vs. 20–24 years).
Chen et al., 2010 (10–14 years vs. 20–24 years).
Chen et al., 2010 (15 years vs. 20–24 years).
Conde-Agudelo et al., 2005 (<16 years vs. 20–24 years).
cCooper et al., 1995 (10–12 years vs. 15 years).
cCooper et al., 1995 (13 years vs. 15 years).
cCooper et al., 1995 (14 years vs. 15 years).
Duenhoelter et al., 1975 (<15 years vs. 19–25 years).
cEkwo and Moawad, 2000 (<16 years vs. 20–24 years).
Hidalgo et al., 2005 (<16 years vs. 20–30 years).
Hulka et al., 1964 (<12–15 years vs. 19–21 years).
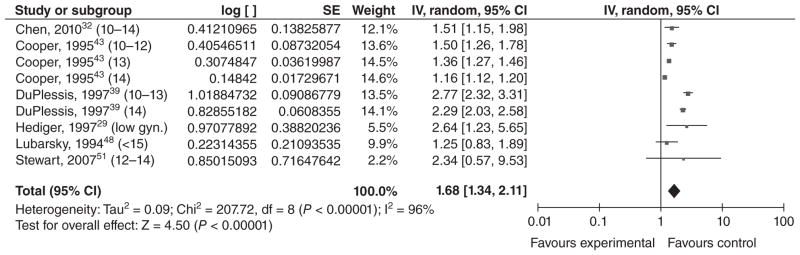
Chen et al., 2010 (10–14 years vs. 20–24 years).
cCooper et al., 1995 (10–12 years vs. 15 years).
cCooper et al., 1995 (13 years vs. 15 years).
cCooper et al., 1995 (14 years vs. 15 years).
DuPlessis et al., 1997 (10–13 years vs. 20–24 years).
DuPlessis et al., 1997 (14 years vs. 20–24 years).
cHediger et al., 1997 (teens ≤15 of gynaecological age <2 years vs. 18–29 years).
Lubarsky et al., 1994 (<15 years vs. 20–29 years).
cStewart et al., 2007 (12–14 years vs. 23–25 years).
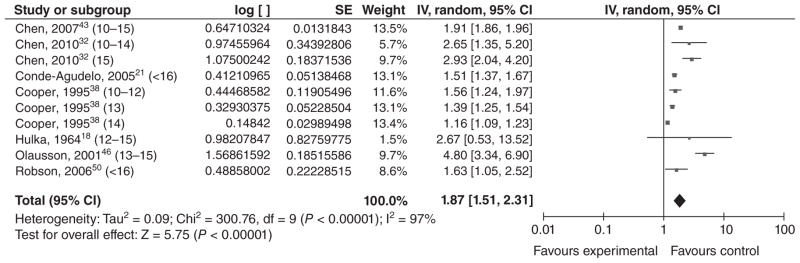
cChen et al., 2007 (10–15 years vs. 20–24 years).
Chen et al., 2010 (10–14 years vs. 20–24 years).
Chen et al., 2010 (15 years vs. 20–24 years).
Conde-Agudelo et al., 2005 (<16 years vs. 20–24 years).
cCooper et al., 1995 (10–12 years vs. 15 years).
cCooper et al., 1995 (13 years vs. 15 years).
cCooper et al., 1995 (14 years vs. 15 years).
Hulka et al., 1964 (<12–15 years vs. 19–21 years).
cOlausson et al., 2001 (13–15 years vs. 20–24 years).
Robson et al., 2006 (<16 years vs. 18–19 years).
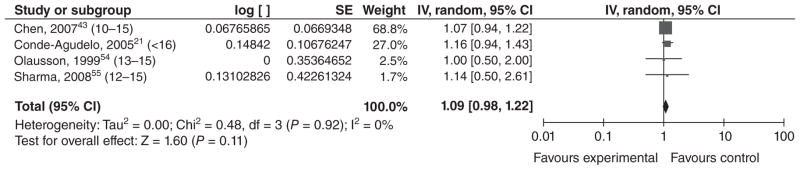
cChen et al., 2007 (10–15 years vs. 20–24 years).
Conde-Agudelo et al., 2005 (<16 years vs. 20–24 years).
cOlausson et al., 1999 (13–15 years vs. 20–24 years).
Sharma et al., 2008 (12–15 years vs. 20–24 years).
References
-
- World Health Organization. [last accessed October 2011];Making Pregnancy Safer: Adolescent Pregnancy. 2011 Updated 2011. http://www.who.int/maternal_child_adolescent/topics/maternal/adolescent_....
-
- The Population Council. Child marriage briefing: ethiopia. 2004.
-
- Ban K. United Nations. The Millennium Development Goals Report 2010. New York: United Nations; 2010. Contract No.: Document Number.
-
- Omran A. The Health Theme in Family Planning. Chapel Hill, NC: Carolina Population Center; 1971.
-
- Taffa N, Obare F. Pregnancy and child health outcomes among adolescents in Ethiopia. Ethiopian Journal of Health and Development. 2004;18:90–95.
Publication types
MeSH terms
Grants and funding
LinkOut - more resources
Full Text Sources
Medical
