. 2012 Aug 3;11(8):4382-91.
doi: 10.1021/pr300467q. Epub 2012 Jul 13.

High density diffusion-free nanowell arrays

Affiliations

High density diffusion-free nanowell arrays

Bharath R Takulapalli et al. J Proteome Res. .

Abstract

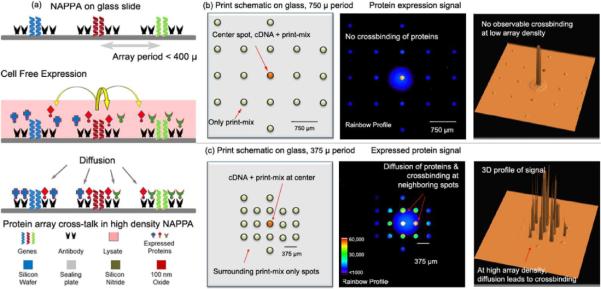
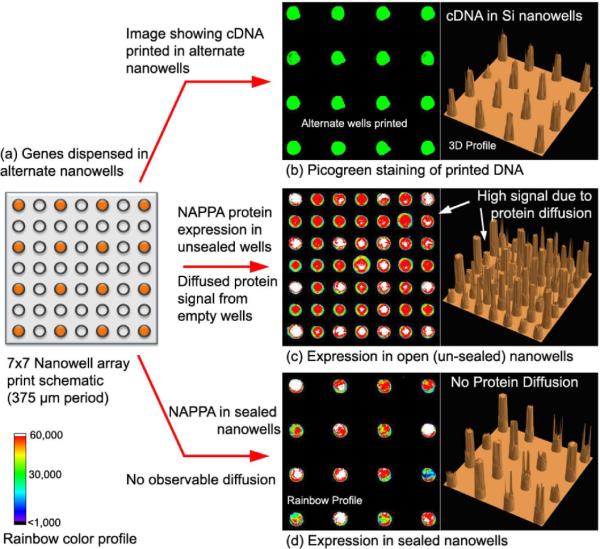
Proteomics aspires to elucidate the functions of all proteins. Protein microarrays provide an important step by enabling high-throughput studies of displayed proteins. However, many functional assays of proteins include untethered intermediates or products, which could frustrate the use of planar arrays at very high densities because of diffusion to neighboring features. The nucleic acid programmable protein array (NAPPA) is a robust in situ synthesis method for producing functional proteins just-in-time, which includes steps with diffusible intermediates. We determined that diffusion of expressed proteins led to cross-binding at neighboring spots at very high densities with reduced interspot spacing. To address this limitation, we have developed an innovative platform using photolithographically etched discrete silicon nanowells and used NAPPA as a test case. This arrested protein diffusion and cross-binding. We present confined high density protein expression and display, as well as functional protein-protein interactions, in 8000 nanowell arrays. This is the highest density of individual proteins in nanovessels demonstrated on a single slide. We further present proof of principle results on ultrahigh density protein arrays capable of up to 24000 nanowells on a single slide.


Figures

Figure 1
Figure 1
Diffusion on glass slides for NAPPA at high array densities. (a) Schematic of NAPPA on glass, with array spacing less than 400 microns. In-situ expressed proteins diffuse in the lysate mixture and cross-bind at neighboring locations. As shown in the print layout schematic to the left, for both (b) and (c), only the center spot was printed with DNA + printing-mix, while the surrounding spots were printed with just printing-mix consisting of anti-GST capture antibodies (no DNA). (b) NAPPA on glass slides with feature period of 750 microns, showing no observable diffusion. (c) NAPPA on glass slides with feature period of 375 microns, showing visible diffusion.
Figure 2
Figure 2
(a) Schematic of NAPPA in Silicon Nanowells; NAPPA samples were piezo dispensed in the wells, which were then filled with lysate and press-sealed with a compliant gasket film supported on a glass slab. Protein expression and subsequent capture by substrate-bound antibody occurred in confined nano-liter volumes, resulting in diffusion-free high density protein arrays (b) Method of fabrication of silicon nanowells; surface functionalization, printing and NAPPA expression (c) Cross-sectional SEM image of nanowells with 375 micron spacing (d) Engineering Arts au302 8-head piezo printer, dispensing on-the-fly into silicon nanowells (e) Schematic of vacuum assisted filling mechanism developed in-house to effectively fill silicon nanowells with IVTT lysate. Silicon nanowell slide is placed in the gasket cutout and sandwiched between the two frames. When the assembly is clamped a thin microfluidic chamber is formed over the slide, enabling filling and sealing proteins (f) Picture showing sealed nanowells filled with lysate.
Figure 3
Figure 3
Confined protein expression in sealed nanowells. (a) Schematic of 16 different genes printed into alternate wells, in a 7 × 7 nanowell array (375 μm period) (b) Pico-green staining of printed DNA; to the right - 3D profile of the signal showing intensity plotted against x & y coordinates (c) Expression in unsealed nanowells detected using an anti-GST antibody. Expressed proteins diffuse locally and physically-adsorb inside neighboring wells, displaying strong signal in all the wells (d) Expression in sealed nanowells detected using an anti-GST antibody. The empty wells in-between do not show any signal, implying no diffusion of protein from sealed wells. 3D profile of protein display to the right clearly shows diffusion-free signals in sealed nanowells. (Refer to Supporting Information for cDNA print details).
Figure 4
Figure 4
SiNW-8K : 8,000 silicon nanowell array with 160 rows × 50 columns, 375 micron array spacing. 287 different genes were piezo-jet printed in a group, into 6-rows and 48-columns. This group pattern was repeat-printed 24 times. Including the DNASU logo, the SiNW-8K array has a total of over 7,000 protein expression spots. (a) Pico-green staining of printed DNA. The dark locations in the printed array block and surrounding the `DNASU' logo correspond to empty nanowells. (b) Display of all expressed proteins detected by an anti-GST antibody. (c) Display of p53 proteins detected by an anti-p53 antibody (d) Corresponding 3D intensity profile of p53 proteins showing very high signal to background, with no diffusion.
Figure 5
Figure 5
Protein-protein interactions in nanowells. (a) Zoomed in image of protein expression in nanowells of a larger array as detected by an anti-GST antibody. FOS and JUN protein features indicated by arrows. (b) Same scale image showing confined FOS expression as detected by an anti-FOS antibody. (c) FOS-JUN interaction with HA-Fos as the query protein and detected with the same anti-FOS antibody as in (b). (d) Fos-Jun interaction assay with HA-Fos as the query, detected by an anti-HA antibody.
Figure 6
Figure 6
Demonstration of very high density protein arrays towards 24,000 proteins on a single slide. 225 micron period nanowell arrays were produced in round-well and square-well geometries, by using different silicon wet-etch chemistries. In both cases, control printing-mix spots (no cDNA) were printed in a plus pattern around the central expression spots. Neither the control printing-mix spots comprising antibodies nor the surrounding empty spots show significant protein diffusion signal (a) Scanning electron microscope (SEM) images of 225 micron period round silicon wells in top and cross-sectional views; inset shows optical microscope image (b) Schematic of print layout in 225 micron period round nanowell array (c) Corresponding protein array display showing high intensity from center cDNA spots with no significant diffusion background (d) SEM and optical microscope images of square nanowell arrays in top and cross-sectional views (e) Schematic of print layout in 225 micron period square nanowell array (f) Expressed proteins are displayed with strong signals (square shaped) from cDNA printed nanowells, while printing-mix printed wells show signals at the sharp edges of the well (and empty wells show no discernible signal). Signal from square edges is thought to be due to preferential aggregation of proteins and dye at the sharp edges of square wells.

Similar articles

Cited by

References

    1. Gibson DS, Qiu J, Mendoza EA, Barker K, Rooney ME, Labaer J. Circulating and synovial antibody profiling of juvenile arthritis patients by nucleic acid programmable protein arrays. Arthritis Res Ther. 14(2):R77. - PMC - PubMed
    1. Anderson KS, Sibani S, Wallstrom G, Qiu J, Mendoza EA, Raphael J, Hainsworth E, Montor WR, Wong J, Park JG, Lokko N, Logvinenko T, Ramachandran N, Godwin AK, Marks J, Engstrom P, Labaer J. Protein microarray signature of autoantibody biomarkers for the early detection of breast cancer. J Proteome Res. 10(1):85–96. - PMC - PubMed
    1. Lin YY, Lu JY, Zhang J, Walter W, Dang W, Wan J, Tao SC, Qian J, Zhao Y, Boeke JD, Berger SL, Zhu H. Protein acetylation microarray reveals that NuA4 controls key metabolic target regulating gluconeogenesis. Cell. 2009;136(6):1073–84. - PMC - PubMed
    1. Loch CM, Cuccherini CL, Leach CA, Strickler JE. Deubiquitylase, deSUMOylase, and deISGylase activity microarrays for assay of substrate preference and functional modifiers. Mol Cell Proteomics. 10(1) M110 002402. - PMC - PubMed
    1. Jones RB, Gordus A, Krall JA, MacBeath G. A quantitative protein interaction network for the ErbB receptors using protein microarrays. Nature. 2006;439(7073):168–74. - PubMed

Publication types