. 2012 Sep 1;40(17):8392-405.
doi: 10.1093/nar/gks565. Epub 2012 Jun 28.

Human Cockayne syndrome B protein reciprocally communicates with mitochondrial proteins and promotes transcriptional elongation

Affiliations

Human Cockayne syndrome B protein reciprocally communicates with mitochondrial proteins and promotes transcriptional elongation

Brian R Berquist et al. Nucleic Acids Res. .

Abstract

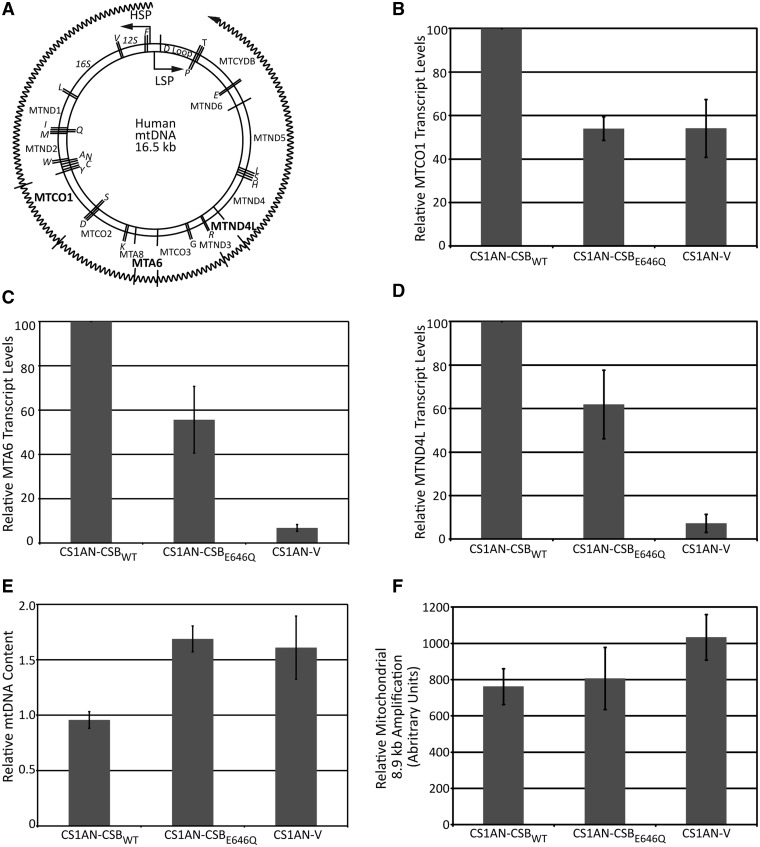
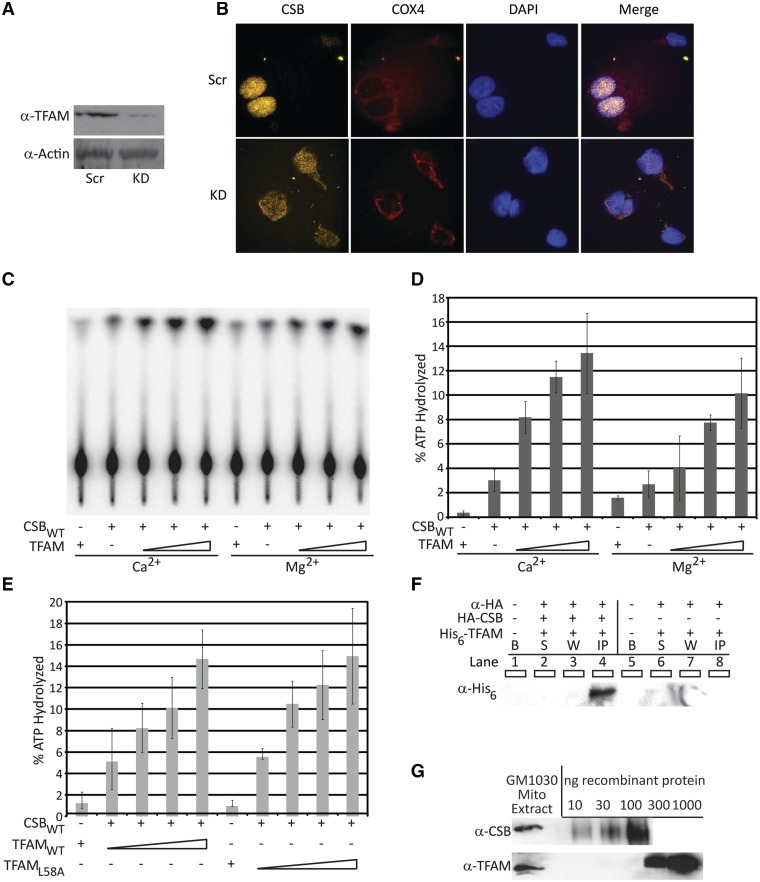
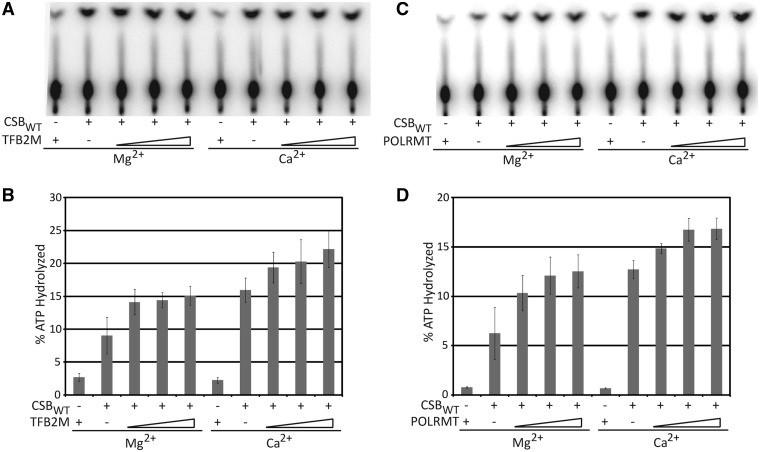
Cockayne syndrome (CS) is a rare human disorder characterized by pathologies of premature aging, neurological abnormalities, sensorineural hearing loss and cachectic dwarfism. With recent data identifying CS proteins as physical components of mitochondria, we sought to identify protein partners and roles for Cockayne syndrome group B (CSB) protein in this organelle. CSB was found to physically interact with and modulate the DNA-binding activity of the major mitochondrial nucleoid, DNA replication and transcription protein TFAM. Components of the mitochondrial transcription apparatus (mitochondrial RNA polymerase, transcription factor 2B and TFAM) all functionally interacted with CSB and stimulated its double-stranded DNA-dependent adenosine triphosphatase activity. Moreover, we found that patient-derived CSB-deficient cells exhibited a defect in efficient mitochondrial transcript production and that CSB specifically promoted elongation by the mitochondrial RNA polymerase in vitro. These observations provide strong evidence for the importance of CSB in maintaining mitochondrial function and argue that the pathologies associated with CS are in part, a direct result of the roles that CSB plays in mitochondria.


Figures

Figure 1.
Figure 1.
CSB-deficient cells display a defect in mitochondrial transcription. (A) Human mitochondrial genome schematic. Genes expressed from the LSP are denoted on the interior, whereas genes expressed from the HSP are denoted on the exterior. Genes for rRNAs and tRNAs (denoted by the single amino acid letter that they code for) are italicized. The exterior wavy line represents the polycistronic transcript generated from the HSP. Transcript segments that were measured are noted with lines through the transcript and gene names listed in bold. (B) Graph displaying relative mitochondrial MTCO1 transcription levels, quantified by Q-RT-PCR, in cells from a patient with CS stably expressing wild-type CSB (CS1AN-CSBWT), stably expressing CSB ATPase dead protein (CS1AN-CSBE646Q) or stably transfected with an empty vector (CS1AN-V). (C) Graph displaying relative mitochondrial MTA6 transcription levels, quantified by Q-RT-PCR, in CS1AN-CSBWT, CS1AN-CSBE646Q or CS1AN-V cells. (D) Graph displaying relative mitochondrial MTND4L transcription levels, quantified by Q-RT-PCR, in CS1AN-CSBWT, CS1AN-CSBE646Q or CS1AN-V cells. (E) Graph displaying relative mtDNA content, quantified by Q-PCR, in CS1AN-CSBWT, CS1AN-CSBE646Q or CS1AN-V cells. (F) Graph displaying relative amplification levels of an 8.9 kb segment of the mitochondrial genome from CS1AN-CSBWT, CS1AN-CSBE646Q or CS1AN-V cells.
Figure 2.
Figure 2.
TFAM directly influences CSB localization and ATPase activity. (A) Western blot displaying TFAM knockdown. Scr, scrambled siRNA; KD, knockdown by TFAM-specific siRNA. (B) Immunofluorescence of CSB re-localization to mitochondria in the absence of TFAM. Far left panel, CSB (yellow) localization; middle left panel, mitochondrial marker protein COX4 (red) localization; right middle panel, DAPI staining (blue) of nuclear DNA; far right panel, merged images of CSB (yellow), COX4 (red) and DAPI (blue) in HeLa cells transfected with non-targeted siRNA (Scr) or TFAM siRNA (KD). (C) TLC plate of CSB ATPase activity in the presence of increasing concentrations of TFAM either with Ca2+ or Mg2+. (D) Graph quantifying TFAM concentration-dependent stimulation of CSB ATPase activity in the presence of either Ca2+ or Mg2+. (E) Graph quantifying TFAMWT or TFAML58A concentration-dependent stimulation of CSB ATPase activity in the presence of Mg2+. Average values are plotted with standard deviations of at least 3 independent experiments. (F) Western blot of CSB:TFAM immunoprecipitated material. B represents empty well, S represents supernatant, W represents wash and IP represents immunoprecipitated material, + indicates presence of protein or antibody. (G) Western blots of CSB (top) or TFAM (bottom) protein levels in GM1030 mitochondrial extract. Recombinant CSB (10, 30 or 100 ng) or recombinant TFAM (10, 30, 100, 300 and 1000 ng) were included to estimate efficiency of antibody recognition in order to calculate approximate protein concentration per microgram of mitochondrial extract for each.
Figure 3.
Figure 3.
CSB can remove TFAM from dsDNA. (A) Representative denaturing polyacrylamide gel displaying CSB-mediated TFAM removal/rearrangement. (B) Graph quantifying CSB TFAM removal/rearrangement as measured by BamHI restriction enzyme site accessibility. (C) Representative native polyacrylamide gel illustrating CSB-mediated TFAM removal. (D) Graph quantifying CSB TFAM removal as measured by ratio of bound to unbound substrate. Average values are plotted with standard deviations of at least 3 independent experiments.
Figure 4.
Figure 4.
TFB2M and POLRMT stimulate the dsDNA-dependent ATPase activity of CSB. (A) TLC plate of CSB ATPase activity in the presence of increasing concentrations of TFB2M either with Mg2+ or Ca2+. (B) Graph quantifying TFB2M concentration-dependent stimulation of CSB ATPase activity in the presence of either Mg2+ or Ca2+. (C) TLC plate of CSB ATPase activity in the presence of increasing concentrations of POLRMT either with Mg2+ or Ca2+. (D) Graph quantifying POLRMT concentration-dependent stimulation of CSB ATPase activity in the presence of either Mg2+ or Ca2+. Average values are plotted with standard deviations of at least 3 independent experiments.
Figure 5.
Figure 5.
CSB promotes POLRMT elongation. (A) Representative denaturing polyacrylamide gel showing inhibition of mitochondrial transcription initiation by CSB. (B) Representative denaturing polyacrylamide gel displaying CSB enhancement of POLRMT transcriptional elongation. (C) Graph quantifying relative ratios of long/short (>1500 nt/∼20 nt) RNA transcripts produced by POLRMT in the presence of increasing concentrations of CSB. Average values are plotted with standard deviations of at least 3 independent experiments.

References

    1. Brooks PJ, Cheng TF, Cooper L. Do all of the neurologic diseases in patients with DNA repair gene mutations result from the accumulation of DNA damage? DNA Repair. 2008;7:834–848. - PMC - PubMed
    1. Natale V. A comprehensive description of the severity groups in Cockayne syndrome. Am J. Med. Genet. A. 2011;155A:1081–1095. - PubMed
    1. Mallery DL, Tanganelli B, Colella S, Steingrimsdottir H, van Gool AJ, Troelstra C, Stefanini M, Lehmann AR. Molecular analysis of mutations in the CSB (ERCC6) gene in patients with Cockayne syndrome. Am. J. Hum. Genet. 1998;62:77–85. - PMC - PubMed
    1. Colella S, Nardo T, Botta E, Lehmann AR, Stefanini M. Identical mutations in the CSB gene associated with either Cockayne syndrome or the DeSanctis–Cacchione variant of xeroderma pigmentosum. Hum. Mol. Genet. 2000;9:1171–1175. - PubMed
    1. Meira LB, Graham JM, Jr, Greenberg CR, Busch DB, Doughty AT, Ziffer DW, Coleman DM, Savre-Train I, Friedberg EC. Manitoba aboriginal kindred with original cerebro-oculo-facio-skeletal syndrome has a mutation in the Cockayne syndrome group B (CSB) gene. Am. J. Hum. Genet. 2000;66:1221–1228. - PMC - PubMed

Publication types

MeSH terms