. 2012 Aug 17;287(34):29062-74.
doi: 10.1074/jbc.M112.377853. Epub 2012 Jun 28.

A single mutation in a tunnel to the active site changes the mechanism and kinetics of product release in haloalkane dehalogenase LinB

Affiliations

A single mutation in a tunnel to the active site changes the mechanism and kinetics of product release in haloalkane dehalogenase LinB

Lada Biedermannová et al. J Biol Chem. .

Abstract

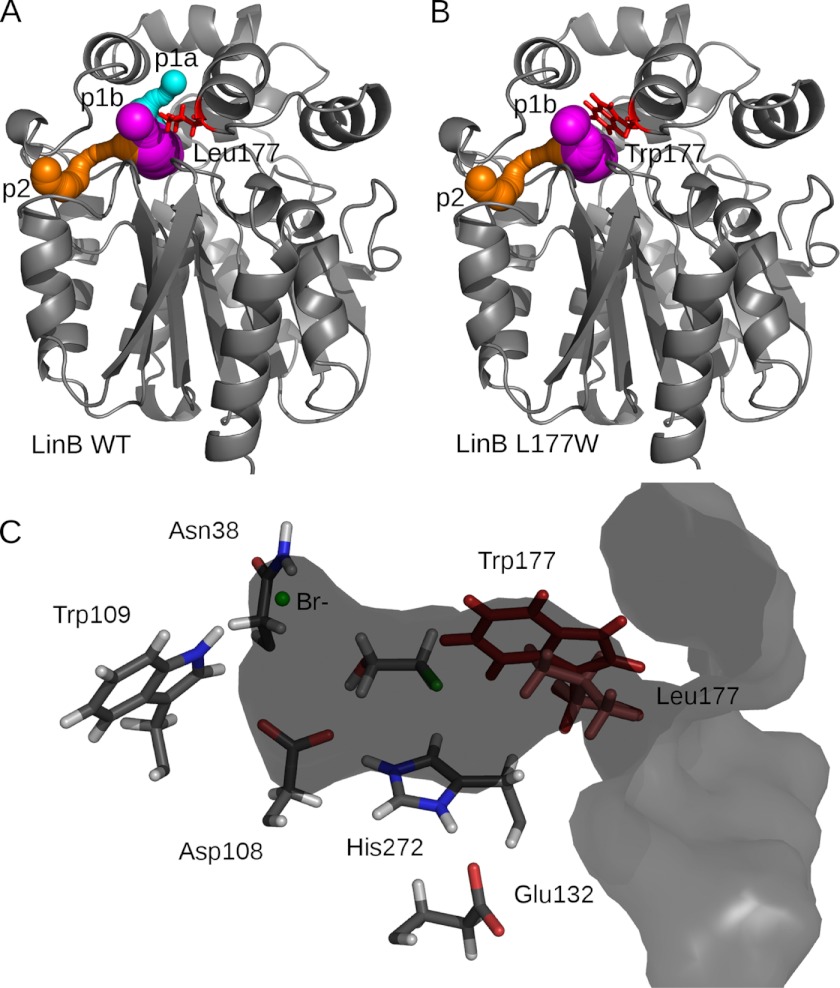
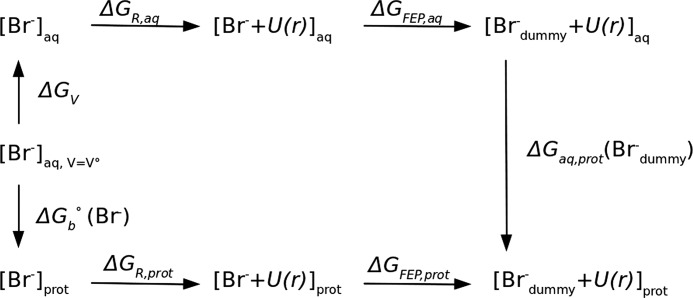
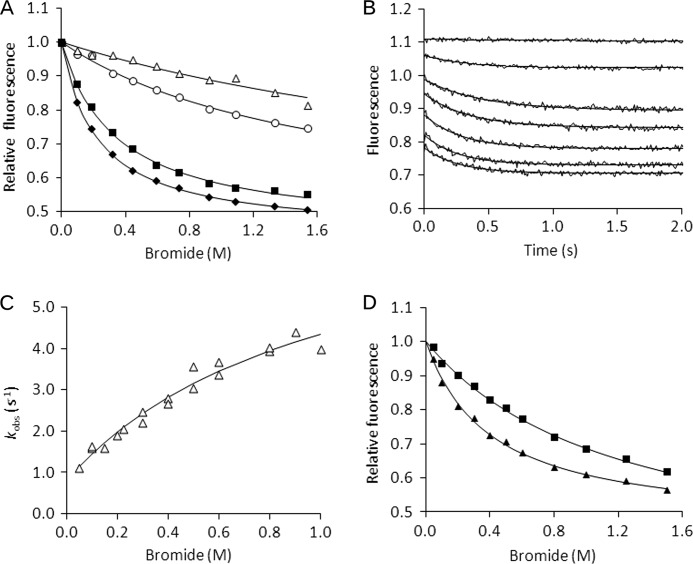
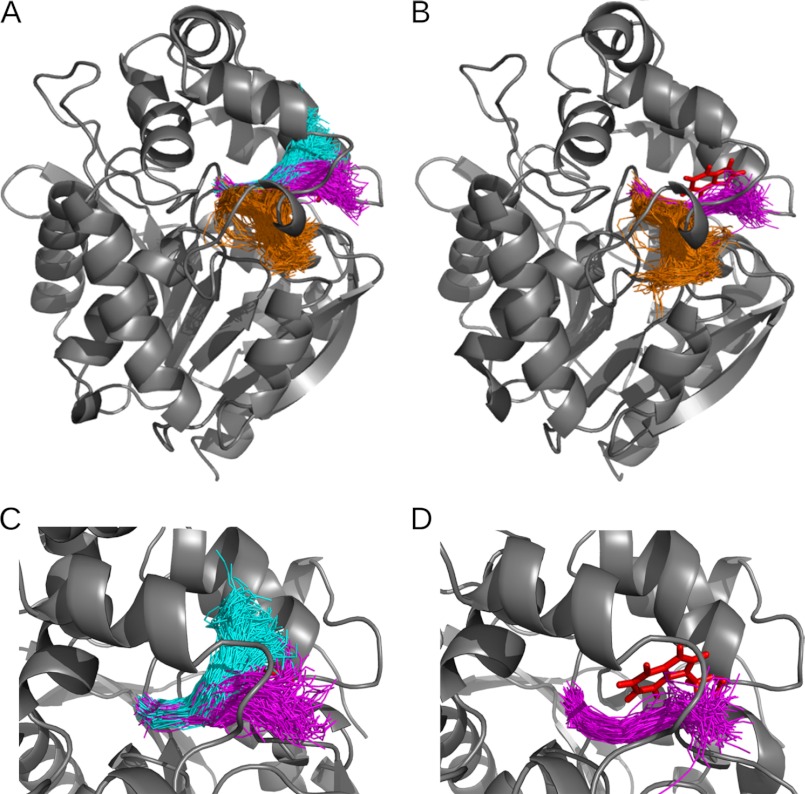
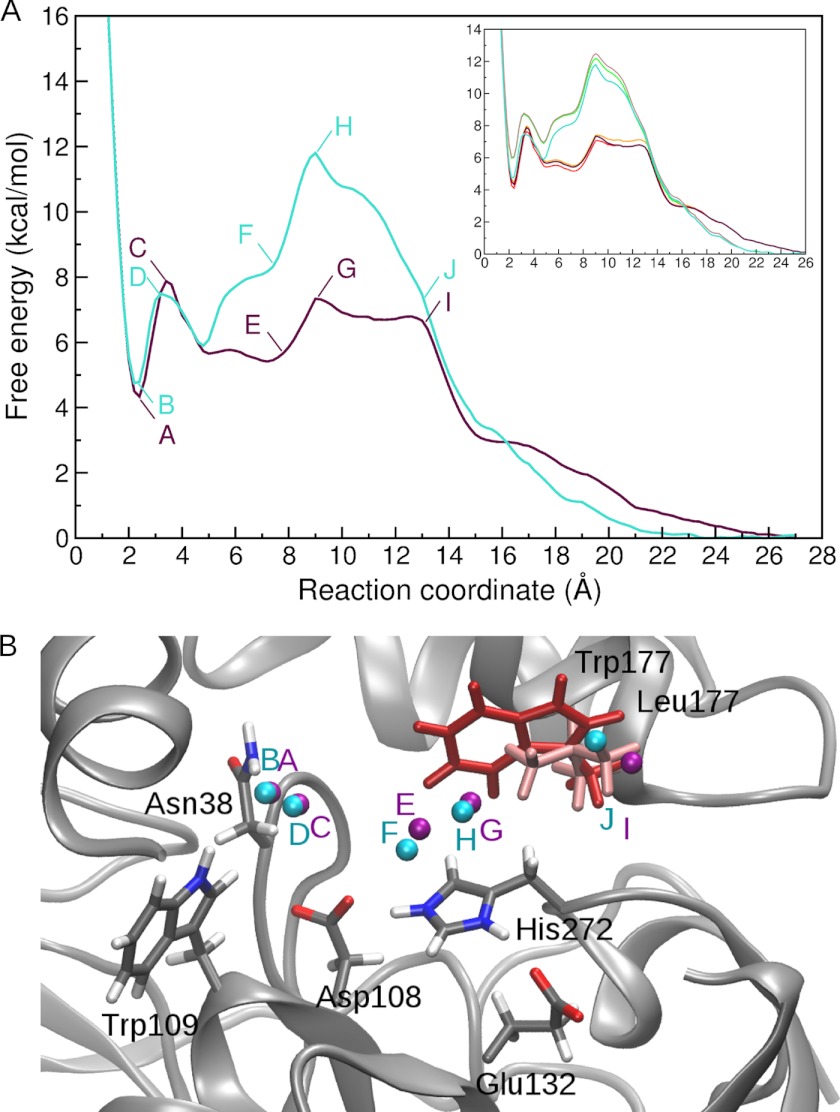
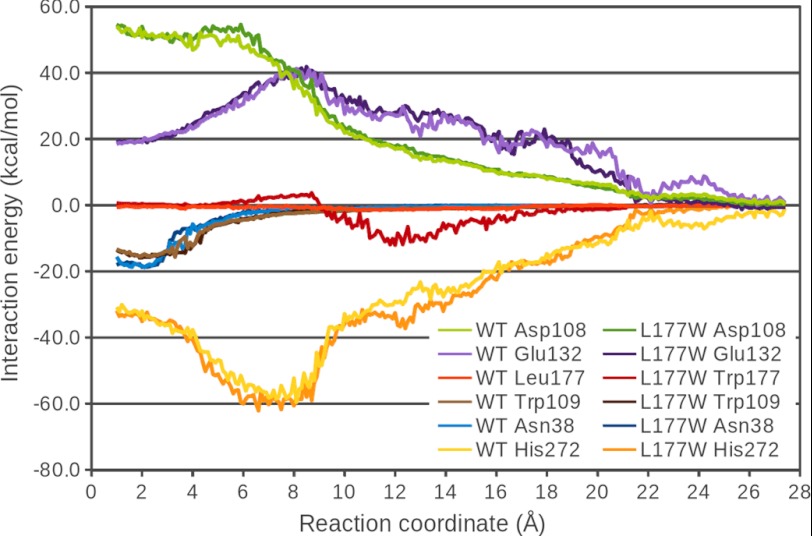
Many enzymes have buried active sites. The properties of the tunnels connecting the active site with bulk solvent affect ligand binding and unbinding and also the catalytic properties. Here, we investigate ligand passage in the haloalkane dehalogenase enzyme LinB and the effect of replacing leucine by a bulky tryptophan at a tunnel-lining position. Transient kinetic experiments show that the mutation significantly slows down the rate of product release. Moreover, the mechanism of bromide ion release is changed from a one-step process in the wild type enzyme to a two-step process in the mutant. The rate constant of bromide ion release corresponds to the overall steady-state turnover rate constant, suggesting that product release became the rate-limiting step of catalysis in the mutant. We explain the experimental findings by investigating the molecular details of the process computationally. Analysis of trajectories from molecular dynamics simulations with a tunnel detection software reveals differences in the tunnels available for ligand egress. Corresponding differences are seen in simulations of product egress using a specialized enhanced sampling technique. The differences in the free energy barriers for egress of a bromide ion obtained using potential of mean force calculations are in good agreement with the differences in rates obtained from the transient kinetic experiments. Interactions of the bromide ion with the introduced tryptophan are shown to affect the free energy barrier for its passage. The study demonstrates how the mechanism of an enzymatic catalytic cycle and reaction kinetics can be engineered by modification of protein tunnels.


Figures

FIGURE 1.
FIGURE 1.
A, crystal structure of LinB WT (Protein Data Bank code 1MJ5) (gray schematic) with CAVER-calculated tunnels shown in sphere representation as follows: p1a tunnel (cyan), p1b tunnel (magenta), and p2 tunnel (orange). B, model structure of LinB L177W with tunnels, same color-coding as for LinB WT. C, LinB WT in surface representation, clipped through the active site and p1b tunnel. The catalytic residues and halide-stabilizing residues are shown in stick representation (Leu-177, light red), together with the 2-bromoethanol product docked in the active site with AutoDock 4.0 and the bromide ion. The position of the modeled Trp-177 (dark red) is shown for reference.
FIGURE 2.
FIGURE 2.
Thermodynamic cycle used to determine the standard free energy of binding ΔGb0 of a bromide ion to LinB using the double decoupling method. ΔGFEP is the free energy for Br decoupling obtained from the FEP simulation (Brdummy stands for the fully decoupled, noninteracting particle); ΔGV is the free energy for changing from the standard-state volume V0 to the sampled unbound volume; ΔGR is the free energy to remove the restraining potential U(r). Subscripts aq and prot denote positions in bulk solvent environment and in at the protein-binding site, respectively.
FIGURE 3.
FIGURE 3.
Steady-state and stopped-flow fluorescence analysis of bromide binding at 37 °C in 100 mm glycine buffer, pH 8.6. A, steady-state fluorescence of 5 μm BSA (open triangles), 20 μm NATA (open circles), 20 μm LinB WT (black squares), and 20 μm LinB L177W (black diamonds); solid lines represent the best fits obtained by using Equation 6. B, fluorescence traces obtained upon rapid mixing of 30 μm LinB L177W with bromide ion to a final concentration of 0–2 m; solid lines represent the best fits to the data by using a single exponential equation. C, dependence of observed rate constant (kobs) of the slow kinetic phase on bromide ion concentration; solid line represents the best fit obtained by using Equation 7. D, dependence of fluorescence values on bromide ion concentration analyzed from LinB L177W stopped-flow fluorescence traces after the rapid phase (squares) and after the overall reaction (triangles), and solid lines represent the best fits obtained by using Equation 6.
FIGURE 4.
FIGURE 4.
Top ranked tunnel clusters identified in MD simulations of LinB WT and LinB L177W using CAVER 3.0. The tunnel cluster representing the p1b branch of the main tunnel is colored in magenta; p1a branch of the main tunnel is in cyan; and p2 tunnel is in orange. Tunnels identified in snapshots of the MD simulation are shown as tunnel center lines in one snapshot of protein conformation. Only a subset of the tunnel snapshots is shown for clarity. Other tunnel clusters (identified in less than 1% of MD snapshots) are omitted. Tunnel clusters are identified in LinB WT (A) and in LinB L177W (B). Close-up view is shown of the main tunnel (p1a and p1b) in LinB WT (C) and of the p1b branch of the main tunnel in LinB L177W (D). In LinB WT, the Leu-177 residue is hidden behind the center lines of the tunnels. In LinB L177W, the p1a branch of the main tunnel was not observed; the Trp-177 residue, which blocks the p1a tunnel, is shown in red stick representation. The figure was generated using the PyMOL visualization software.
FIGURE 5.
FIGURE 5.
Free energy profiles from ABF simulations of bromide ion exit in LinB WT (purple) and LinB L177W (turquoise). Convergence of the free energy profiles with increasing number of samples per bin is shown in the inset; profiles for 70,000, 80,000, and 90,000 samples per bin are shown for LinB WT (yellow, orange, and purple, respectively) and LinB L177W (green, brown, and turquoise, respectively) (A). Position of the bromide ion in selected snapshots of ABF simulations for LinB WT (purple spheres) and LinB L177W (turquoise spheres) are shown (B). The labels indicate the corresponding position on the free energy profile. The LinB WT is shown in the starting conformation of the ABF simulations in gray schematic representation, with important residues highlighted in stick representation. The Leu-177 residue is colored light red, and the Trp-177 residue from LinB L177W is superimposed for reference and colored dark red.
FIGURE 6.
FIGURE 6.
Total interaction energy (electrostatic and van der Waals) of the bromide ion with selected residues as a function of the bromide position along the ABF reaction coordinate.

References

    1. Khalili-Araghi F., Gumbart J., Wen P. C., Sotomayor M., Tajkhorshid E., Schulten K. (2009) Molecular dynamics simulations of membrane channels and transporters. Curr. Opin. Struct. Biol. 19, 128–137 - PMC - PubMed
    1. Gouaux E., Mackinnon R. (2005) Principles of selective ion transport in channels and pumps. Science 310, 1461–1465 - PubMed
    1. Voss N. R., Gerstein M., Steitz T. A., Moore P. B. (2006) The geometry of the ribosomal polypeptide exit tunnel. J. Mol. Biol. 360, 893–906 - PubMed
    1. Petrone P. M., Snow C. D., Lucent D., Pande V. S. (2008) Side-chain recognition and gating in the ribosome exit tunnel. Proc. Natl. Acad. Sci. U.S.A. 105, 16549–16554 - PMC - PubMed
    1. Winn P. J., Lüdemann S. K., Gauges R., Lounnas V., Wade R. C. (2002) Comparison of the dynamics of substrate access channels in three cytochrome P450s reveals different opening mechanisms and a novel functional role for a buried arginine. Proc. Natl. Acad. Sci. U.S.A. 99, 5361–5366 - PMC - PubMed

Publication types

LinkOut - more resources