Review
. 2013 Feb;193(2):327-45.
doi: 10.1534/genetics.112.143313. Epub 2012 Jun 28.

Whole-genome regression and prediction methods applied to plant and animal breeding

Affiliations
Review

Whole-genome regression and prediction methods applied to plant and animal breeding

Gustavo de Los Campos et al. Genetics. 2013 Feb.

Abstract

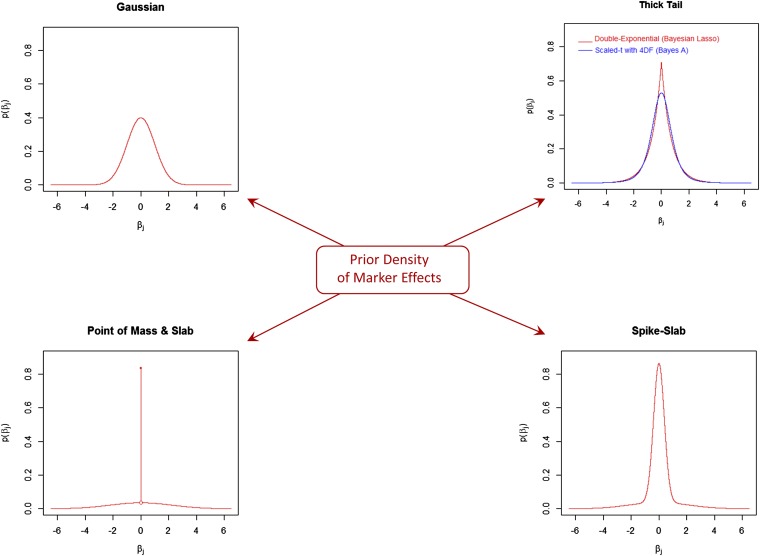
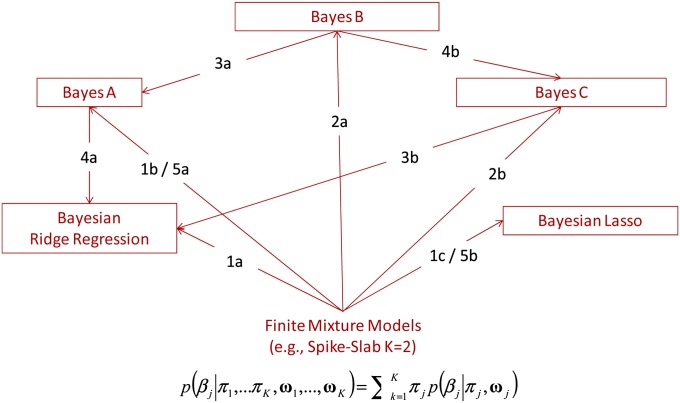
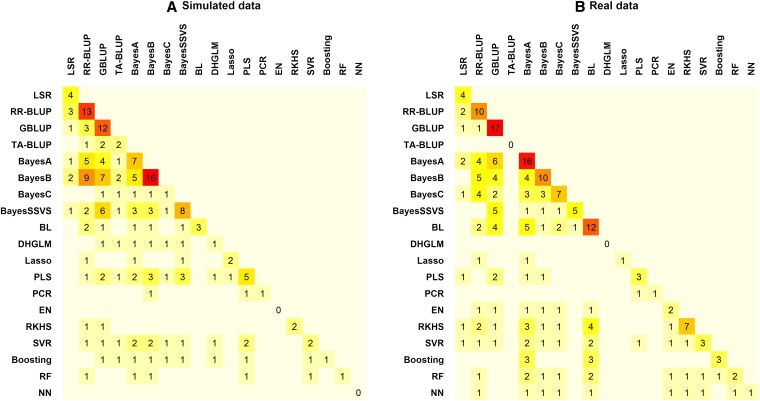
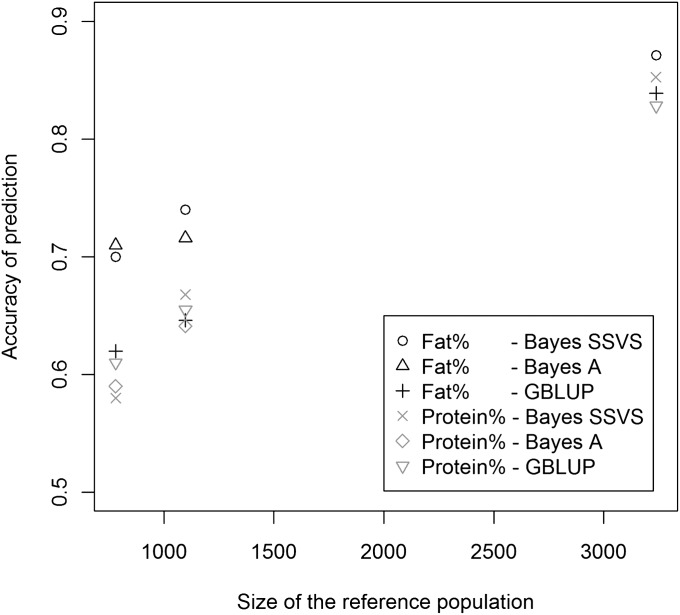
Genomic-enabled prediction is becoming increasingly important in animal and plant breeding and is also receiving attention in human genetics. Deriving accurate predictions of complex traits requires implementing whole-genome regression (WGR) models where phenotypes are regressed on thousands of markers concurrently. Methods exist that allow implementing these large-p with small-n regressions, and genome-enabled selection (GS) is being implemented in several plant and animal breeding programs. The list of available methods is long, and the relationships between them have not been fully addressed. In this article we provide an overview of available methods for implementing parametric WGR models, discuss selected topics that emerge in applications, and present a general discussion of lessons learned from simulation and empirical data analysis in the last decade.


Figures

Figure 1
Figure 1
Commonly used prior densities of marker effects (all with zero mean and unit variance). The densities are organized in a way that, starting from the Gaussian in the top left corner, as one moves clockwise, the amount of mass at zero increases and tails become thicker and flatter.
Figure 2
Figure 2
Relationships between some prior densities commonly assigned to marker effects.
Figure 3
Figure 3
(A and B) Number of articles reviewed comparing one or more methods using simulated (A) or real (B) data. The abbreviations used for the methods are given in Table 2. The following references were used: (Meuwissen et al. 2001; Habier et al. 2007; Piyasatian et al. 2007; González-Recio et al. 2008; Lee et al. 2008; Bennewitz et al. 2009; de los Campos et al. 2009; Gonzalez-Recio et al. 2009; Hayes et al. 2009a,b; Lorenzana and Bernardo 2009; Luan et al. 2009; Lund et al. 2009; Meuwissen 2009; Meuwissen et al. 2009; Moser et al. 2009; Solberg et al. 2009; Usai et al. 2009; Verbyla et al. 2009; Zhong et al. 2009; Andreescu et al. 2010; Bastiaansen et al. 2010; Coster et al. 2010; Crossa et al. 2010; Daetwyler et al. 2010a,b; de los Campos et al. 2010a,b; Gonzalez-Recio et al. 2010; Gredler et al. 2010; Guo et al. 2010; Habier et al. 2010; Konstantinov and Hayes 2010; Meuwissen and Goddard 2010; Mrode et al. 2010; Pérez et al. 2010; Shepherd et al. 2010; Zhang et al. 2010; Calus and Veerkamp 2011; Clark et al. 2011; Croiseau et al. 2011; de Roos et al. 2011; Gonzalez-Recio and Forni 2011; Habier et al. 2011; Heffner et al. 2011; Iwata and Jannink 2011; Legarra et al. 2011; Long et al. 2011a,b; Makowsky et al. 2011; Mujibi et al. 2011; Ober et al. 2011; Ostersen et al. 2011; Pryce et al. 2011; Pszczola et al. 2011; Wiggans et al. 2011; Wittenburg et al. 2011; Wolc et al. 2011a,b; Yu and Meuwissen 2011; Bastiaansen et al. 2012; Heslot et al. 2012).
Figure 4
Figure 4
Accuracies of G-BLUP, BayesA, and Bayes SSVS models for fat and protein percentage, estimated using three different Holstein–Friesian reference populations (Hayes et al. 2009b; Verbyla et al. 2009; de Roos et al. 2011). Note that the data used by Hayes et al. (2009b) are a subset of the data used by Verbyla et al. (2009).

References

    1. Aguilar I., Misztal I., Johnson D. L., Legarra A., Tsuruta S., et al. , 2010. Hot topic: a unified approach to utilize phenotypic, full pedigree, and genomic information for genetic evaluation of Holstein final score. J. Dairy Sci. 93: 743–752 - PubMed
    1. Andreescu C., Habier D., Fernando R. L., Kranis A., Watson K., et al. , 2010. Accuracy of genomic predictions across breeding lines of chickens. 9th World Congress on Genetics Applied to Livestock Production, Leipzig, Germany. CD-ROM Communication 0956
    1. Andrews D. F., Mallows C. L., 1974. Scale mixtures of normal distributions. J. R. Stat. Soc., B 36: 99–102
    1. Bastiaansen, J. W. M., M. C. A. M. Bink, A. Coster, C. Maliepaard, and M. P. L. Calus, 2010 Comparison of analyses of the QTLMAS XIII common dataset. I: Genomic selection. BMC Proc. 4(Suppl. 1): S1. - PMC - PubMed
    1. Bastiaansen J. W. M., Coster A., Calus M. P. L., van Arendonk J. A. M., Bovenhuis H., 2012. Long-term response to genomic selection: effects of estimation method and reference population structure for different genetic architectures. Genet. Sel. Evol. 44: 3. - PMC - PubMed

Publication types