

Mapping quantitative trait loci onto a phylogenetic tree
- PMID: 22745229
- PMCID: PMC3430541
- DOI: 10.1534/genetics.112.142448
Mapping quantitative trait loci onto a phylogenetic tree
Abstract
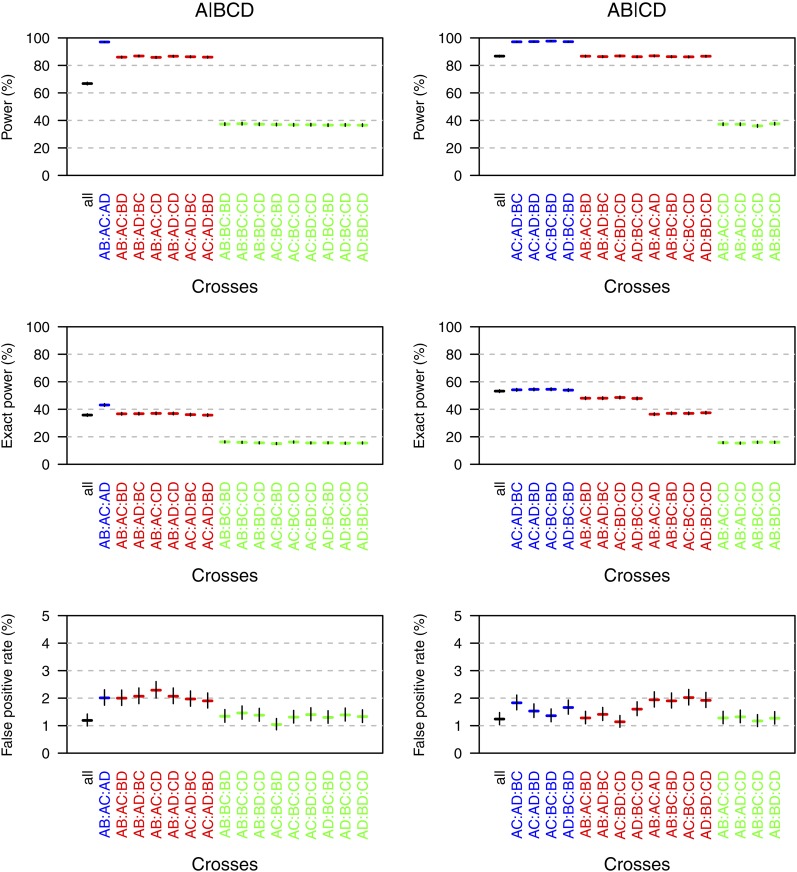
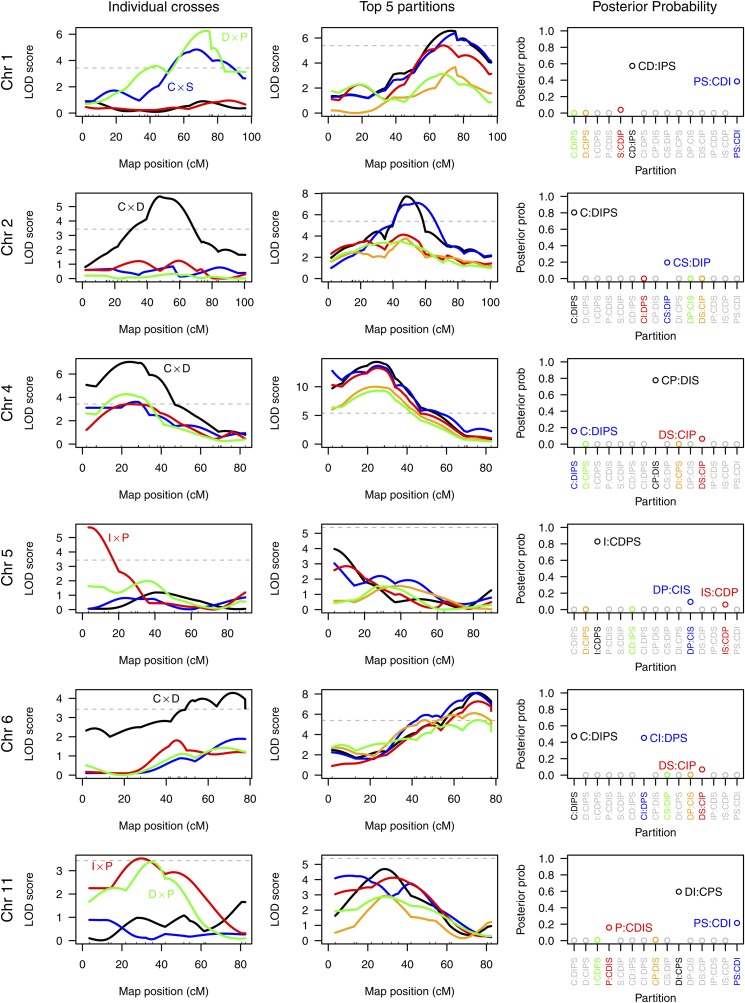
Despite advances in genetic mapping of quantitative traits and in phylogenetic comparative approaches, these two perspectives are rarely combined. The joint consideration of multiple crosses among related taxa (whether species or strains) not only allows more precise mapping of the genetic loci (called quantitative trait loci, QTL) that contribute to important quantitative traits, but also offers the opportunity to identify the origin of a QTL allele on the phylogenetic tree that relates the taxa. We describe a formal method for combining multiple crosses to infer the location of a QTL on a tree. We further discuss experimental design issues for such endeavors, such as how many crosses are required and which sets of crosses are best. Finally, we explore the method's performance in computer simulations, and we illustrate its use through application to a set of four mouse intercrosses among five inbred strains, with data on HDL cholesterol.
Figures
Similar articles
-
QTL mapping for genetic determinants of lipoprotein cholesterol levels in combined crosses of inbred mouse strains.J Lipid Res. 2006 Aug;47(8):1780-90. doi: 10.1194/jlr.M500544-JLR200. Epub 2006 May 9. J Lipid Res. 2006. PMID: 16685081
-
Quantitative trait loci that determine lipoprotein cholesterol levels in an intercross of 129S1/SvImJ and CAST/Ei inbred mice.Physiol Genomics. 2004 Mar 12;17(1):60-8. doi: 10.1152/physiolgenomics.00142.2003. Physiol Genomics. 2004. PMID: 14701919
-
Advances in Bayesian multiple quantitative trait loci mapping in experimental crosses.Heredity (Edinb). 2008 Mar;100(3):240-52. doi: 10.1038/sj.hdy.6801074. Epub 2007 Nov 7. Heredity (Edinb). 2008. PMID: 17987056 Free PMC article. Review.
-
Using advanced intercross lines for high-resolution mapping of HDL cholesterol quantitative trait loci.Genome Res. 2003 Jul;13(7):1654-64. doi: 10.1101/gr.1185803. Epub 2003 Jun 12. Genome Res. 2003. PMID: 12805272 Free PMC article.
-
QTL mapping in intercross and backcross populations.Methods Mol Biol. 2009;573:157-73. doi: 10.1007/978-1-60761-247-6_9. Methods Mol Biol. 2009. PMID: 19763927 Review.
Cited by
-
Heritability and coefficient of genetic variation analyses of phenotypic traits provide strong basis for high-resolution QTL mapping in the Collaborative Cross mouse genetic reference population.Mamm Genome. 2014 Apr;25(3-4):109-19. doi: 10.1007/s00335-014-9503-5. Epub 2014 Jan 21. Mamm Genome. 2014. PMID: 24445421
-
Integrating natural history collections and comparative genomics to study the genetic architecture of convergent evolution.Philos Trans R Soc Lond B Biol Sci. 2019 Jul 22;374(1777):20180248. doi: 10.1098/rstb.2018.0248. Epub 2019 Jun 3. Philos Trans R Soc Lond B Biol Sci. 2019. PMID: 31154982 Free PMC article. Review.
-
The evolution of hybrid incompatibilities along a phylogeny.Evolution. 2013 Oct;67(10):2905-22. doi: 10.1111/evo.12173. Epub 2013 Jun 20. Evolution. 2013. PMID: 24094342 Free PMC article.
-
The Pace of Hybrid Incompatibility Evolution in House Mice.Genetics. 2015 Sep;201(1):229-42. doi: 10.1534/genetics.115.179499. Epub 2015 Jul 20. Genetics. 2015. PMID: 26199234 Free PMC article.
-
Combining Linkage and Association Mapping Approaches to Study the Genetic Architecture of Verticillium Wilt Resistance in Sunflower.Plants (Basel). 2025 Apr 11;14(8):1187. doi: 10.3390/plants14081187. Plants (Basel). 2025. PMID: 40284075 Free PMC article.
References
-
- Bradshaw H. D., Wilbert S. M., Otto K. G., Schemske D. W., 1995. Genetic mapping of floral traits associated with reproductive isolation in monkey flowers (Mimulus). Nature 376: 762–765
-
- Broman K. W., Wu H., Sen S., Churchill G. A., 2003. R/qtl: QTL mapping in experimental crosses. Bioinformatics 19: 889–890 - PubMed
Publication types
MeSH terms
Substances
Grants and funding
LinkOut - more resources
Full Text Sources
Other Literature Sources
