. 2012 Aug;139(15):2692-702.
doi: 10.1242/dev.072314. Epub 2012 Jun 28.

β-Catenin signaling specifies progenitor cell identity in parallel with Shh signaling in the developing mammalian thalamus

Affiliations

β-Catenin signaling specifies progenitor cell identity in parallel with Shh signaling in the developing mammalian thalamus

Krista K Bluske et al. Development. 2012 Aug.

Abstract

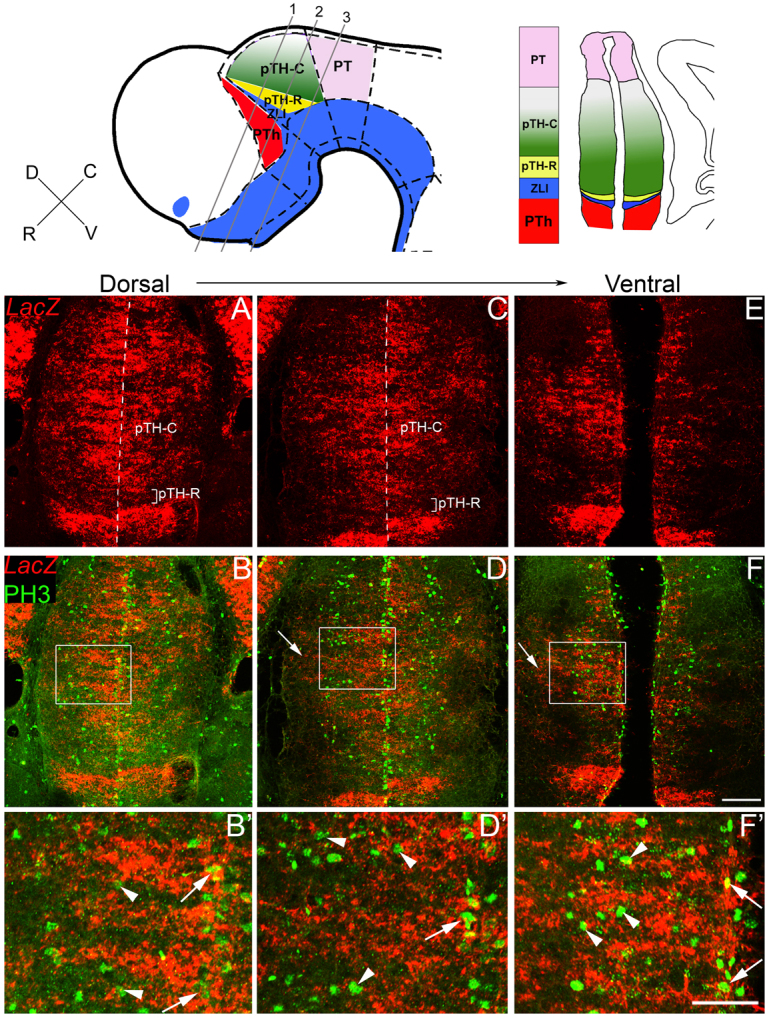
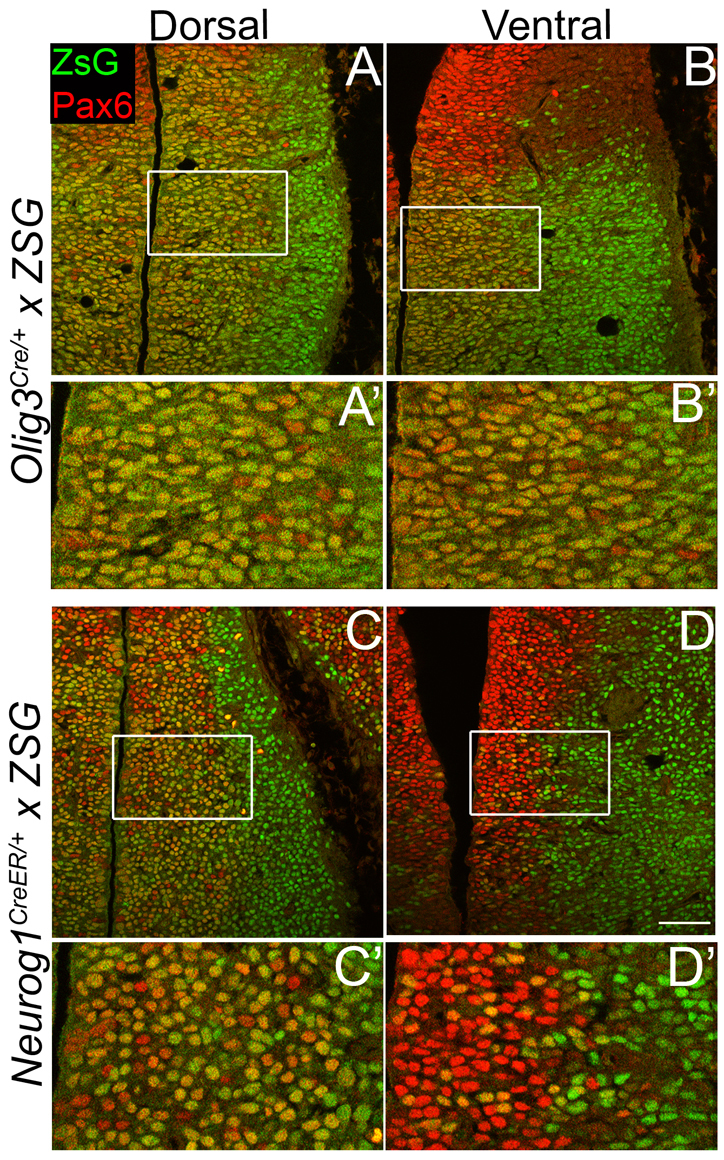
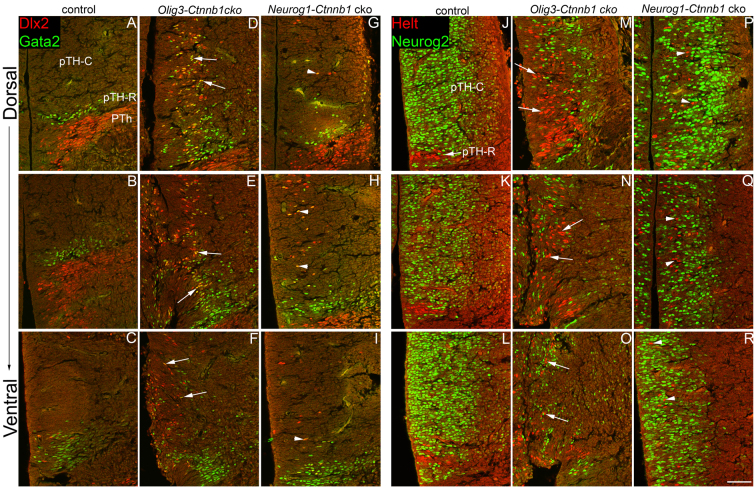
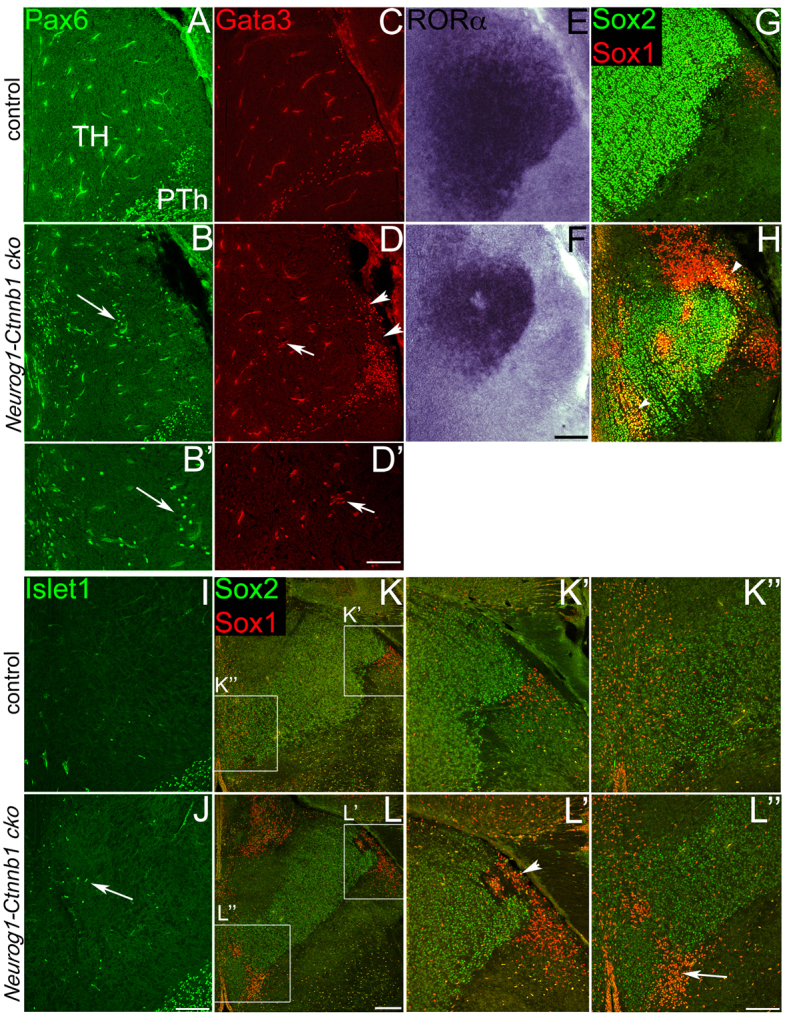
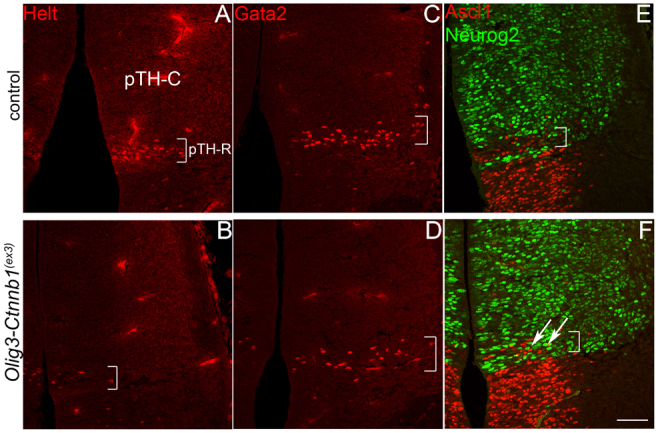
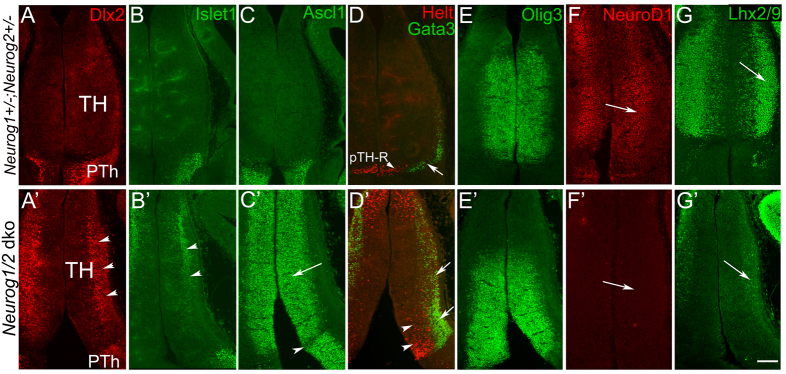
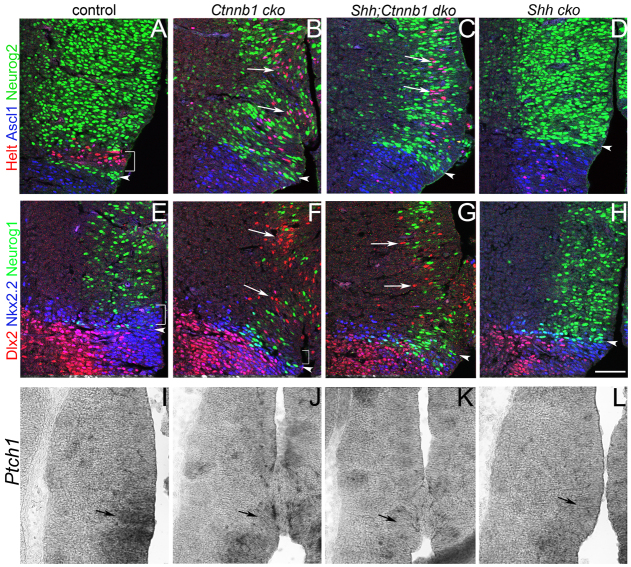
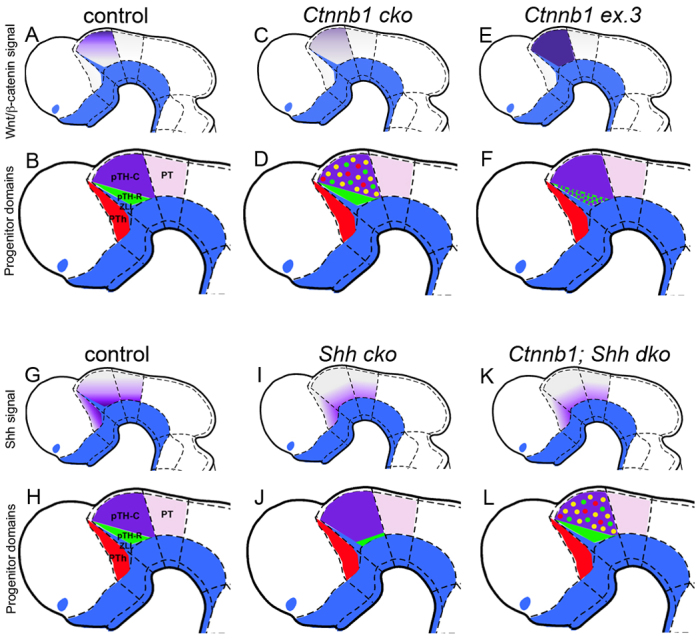
Neural progenitor cells within the developing thalamus are spatially organized into distinct populations. Their correct specification is critical for generating appropriate neuronal subtypes in specific locations during development. Secreted signaling molecules, such as sonic hedgehog (Shh) and Wnts, are required for the initial formation of the thalamic primordium. Once thalamic identity is established and neurogenesis is initiated, Shh regulates the positional identity of thalamic progenitor cells. Although Wnt/β-catenin signaling also has differential activity within the thalamus during this stage of development, its significance has not been directly addressed. In this study, we used conditional gene manipulations in mice and explored the roles of β-catenin signaling in the regional identity of thalamic progenitor cells. We found β-catenin is required during thalamic neurogenesis to maintain thalamic fate while suppressing prethalamic fate, demonstrating that regulation of regional fate continues to require extrinsic signals. These roles of β-catenin appeared to be mediated at least partly by regulating two basic helix-loop-helix (bHLH) transcription factors, Neurog1 and Neurog2. β-Catenin and Shh signaling function in parallel to specify two progenitor domains within the thalamus, where individual transcription factors expressed in each progenitor domain were regulated differently by the two signaling pathways. We conclude that β-catenin has multiple functions during thalamic neurogenesis and that both Shh and β-catenin pathways are important for specifying distinct types of thalamic progenitor cells, ensuring that the appropriate neuronal subtypes are generated in the correct locations.


Figures

Fig. 1.
Fig. 1.
β-Catenin-controlled transcriptional activity in multiple cell populations during thalamic neurogenesis. (Top left) Side view of the diencephalon. The axis refers to orientation in the thalamus. Three frontal section planes (1-3) are shown (gray lines). (Top right) A frontal section from plane 2. Because frontal sections are between horizontal and coronal orientations, several diencephalic regions can be observed in the same section. The bottom of the section contains rostroventral regions of the diencephalon and the top contains caudodorsal regions. Comparing sections 1-3 also reveals the dorsoventral difference within the thalamus; section 1 contains dorsal regions of the thalamus; section 3 contains ventral regions. (A-F′) In situ hybridization (ISH) for lacZ mRNA on frontal sections from E12.5 BAT-gal transgenic mice. A-B′ are from approximately section plane 1, C-D′ from plane 2, and E-F′ from plane 3. The dotted line in A and C indicates the midline. The arrows in D and F indicate lacZ expression in the mantle zone. B′,D′,F′ are higher magnification images of the boxed regions in B,D,F, respectively; midline is on the right. The arrows (B′,D′,F′) indicate apically dividing PH3+ cells surrounded by lacZ signal, and the arrowheads (B,D′,F′) indicate basally dividing PH3+ cells surrounded by lacZ signal. Scale bars: 100 μm in A-F; 50 μm in B′,D′,F′.
Fig. 2.
Fig. 2.
Cre-mediated recombination with Olig3Cre and Neurog1CreERT2 alleles. (A-D′) Recombination was assessed with CAG-loxP-stop-loxP-ZsGreen reporter mice. E12.5 Olig3Cre/+; ZsGreen/+ (A-B′) and Neurog1CreERT2/+; ZsGreen/+ embryos (tamoxifen administered at E10.5) show overlap of ZSGreen (ZSG) signal with Pax6. A′,B′,C′,D′ are high-magnification images of the regions boxed in A,B,C,D, respectively. Dorsal sections are from approximately plane 2 and ventral sections from plane 3 (Fig. 1). Third ventricle is on the left. Scale bar: 50 μm.
Fig. 3.
Fig. 3.
Prethalamic and pTH-R markers are ectopically induced within pTH-C in Ctnnb1 cko embryos. E12.5 control (from Olig3-Ctnnb1 litter), Olig3-Ctnnb1 cko, and Neurog1-Ctnnb1 cko (tamoxifen administered at 10.5) immunostained sections from three dorsoventral levels. The third ventricle is on the left. (A-C) Normal expression of the prethalamic marker Dlx2 and pTH-R marker Gata2. (D-F,G-I) Induction of both Dlx2 and Gata2 in pTH-C of Olig3-Ctnnb1 and Neurog1-Ctnnb1 ckos (the arrows and arrowheads indicate Dlx2+/Gata2+ cells). (J-L) Normal expression of Helt and Neurog2 in the pTH-R and pTH-C domains, respectively. (M-O,P-R) Ectopic Helt+ cells scattered throughout pTH-C in the Olig3-Ctnnb1 and Neurog1-Ctnnb1 cko embryos (arrows, arrowheads). Scale bar: 50 μm.
Fig. 4.
Fig. 4.
Incorrect specification and positioning of postmitotic cells in Neurog1-Ctnnb1 cko embryos. (A-H) E14.5 control and Neurog1-Ctnnb1 cko (tamoxifen at E10.5) sections. Midline is on the left. (A-B′) Immunostaining for prethalamic postmitotic marker Pax6. The arrow in B and B′ indicates ectopic Pax6+ cells within the thalamus of the cko. (C-D′) Immunostaining for pTH-R-derived marker Gata3. Scattered Gata3+ cells were found in medial regions of the thalamus (arrow, D,D′); the arrowheads indicate the expanded domain of Gata3+ cells in the IGL/vLG in the cko. B′,D′ are high-magnification images of the indicated region in B and D, respectively. (E,F) ISH for pTH-C-derived postmitotic marker RORα; note reduction in the cko (F). (G,H) Immunostaining for Sox1 and Sox2. The arrowheads in H indicate clusters of ectopic Sox1+/Sox2 cells in the thalamus. (I-L″) E17.5 control and Neurog1-Ctnnb1 cko (tamoxifen at E10.5) sections. (I,J) Immunostaining for prethalamic postmitotic neuronal marker Islet1. The arrow in J indicates Islet1+ cells within the thalamus of the cko. (K-L″) K′,K″,L′,L″ are higher magnification images of the boxed regions in K and L, respectively. Note expanded Sox1+ region in IGL/vLG (arrowhead in L′) and medial clusters of Sox1+ cells in the cko embryos (arrow in L″). Scale bars: 100 μm in A-D,G-J,K′-L″; 200 μm in K,L; 50 μm in B′,D′.
Fig. 5.
Fig. 5.
Stabilized Ctnnb1 in thalamic progenitor cells is sufficient to downregulate pTH-R markers and induce pTH-C markers. (A,C) Normal expression of pTH-R markers Helt and Gata2 (bracket). The third ventricle is on the left. (B,D) Reduced number of Helt+ and Gata2+ cells within pTH-R in Olig3-Ctnnb1(ex3/+) embryos. (E) Normal expression of Neurog2 in pTH-C and Ascl1 in pTH-R. (F) Decrease in the number of Ascl1+ cells and ectopic appearance of Neurog2+ cells within pTH-R of Olig3-Ctnnb1(ex3)/+ embryos (arrows). Scale bar: 50 μm.
Fig. 6.
Fig. 6.
Ectopic induction of prethalamic and pTH-R markers in the Neurog1/2 dko mice. (A-G′) E12.5 Neurog1/Neurog2 double knockout and control (Neurog1+/−; Neurog2+/−) sections. (A,A′) The prethalamic progenitor marker Dlx2 is expressed in the thalamus of the dko embryo (arrowheads in A′). (B,B′) The prethalamic postmitotic marker Islet1 is expressed in the thalamus (arrowheads in B′). (C,C′) The pTH-R/prethalamic marker Ascl1 is robustly expressed in the dko thalamus (arrow in C′). The arrowhead in C′ indicates the ZLI. (D,D′) The pTH-R progenitor marker Helt and pTH-R postmitotic marker Gata3 are expanded in the dko embryo (arrowheads and arrows in D′). (E,E′) The thalamic progenitor marker Olig3. (F,F′) The pTH-C basal progenitor marker NeuroD1 (arrow). (G,G′) The postmitotic pTH-C-derived neuronal marker Lhx2/9; note robust downregulation in the mantle zone of the dko embryo (arrow in G′). Scale bar: 100 μm.
Fig. 7.
Fig. 7.
Interaction between Shh and β-catenin signaling in thalamic patterning. (A-H) Frontal sections at E12.5. The third ventricle is on the right. The ZLI is indicated with an arrowhead; brackets define pTH-R. (A-D) Expression of pTH-C and ZLI marker Neurog2, pTH-R marker Helt and pTH-R/prethalamic marker Ascl1 in control (A), Ctnnb1 cko (B), Ctnnb1; Shh double cko (C), and Shh cko (D) embryos. The arrows in B and C indicate induction of Helt+ and Ascl1+ cells within pTH-C in the Ctnnb1 cko (B) and Ctnnb1; Shh double cko (C). (E-H) Expression of pTH-C marker Neurog1, prethalamic marker Dlx2, and pTH-R/prethalamic marker Nkx2-2 in control (E), Ctnnb1 cko (F), Ctnnb1; Shh double cko (G), and Shh cko embryos (H). The arrows in G indicate Dlx2+ cells throughout the thalamus in the Ctnnb1 cko (F) and Ctnnb1; Shh double cko. (I-L) ISH for Shh target gene Ptch1 in control (I), Ctnnb1 cko (J), Ctnnb1; Shh double cko (K), and Shh cko (L) embryos. The arrow in I indicates the position caudal to the ZLI where Ptch1 expression is normally high. Note decreased Ptch1 in K,L. Scale bar: 50 μm in A-H; 100 μm in I-L.
Fig. 8.
Fig. 8.
Summary of thalamic progenitor domain phenotypes after manipulation of β-catenin and/or Shh signaling. Schematic representations illustrate a side view of the thalamus. (A,B,G,H) The thalamus of control embryos, with normal β-catenin and Shh signaling, is partitioned into two progenitor domains: pTH-R and pTH-C. (C,D) Conditional deletion of Ctnnb1 within the thalamus causes induction of prethalamic (red) and pTH-R markers Helt and Ascl1 (green) within pTH-C (this does not represent Nkx2-2, which is not induced beyond the pTH-R); the yellow dots represent progenitor cells positive for both markers. (E,F) Expression of constitutively active β-catenin causes induction of pTH-C fate within pTH-R (purple) and a decrease in progenitor cells with pTH-R identity (green). (I,J) In ZLI-specific Shh ckos, pTH-R identity is decreased near the ZLI (green), and the pTH-C domain (purple) expands. (K,L) In Ctnnb1;Shh double ckos, prethalamic and pTH-R markers are induced, similar to Ctnnb1 single ckos (D).

References

    1. Agren M., Kogerman P., Kleman M. I., Wessling M., Toftgard R. (2004). Expression of the Ptch1 tumor suppressor gene is regulated by alternative promotors and a single functional Gli-binding site. Gene 330, 101-114 - PubMed
    1. Alvarez-Medina R., Cayuso J., Okubo T., Takada S., Marti E. (2008). Wnt canonical pathway restricts graded Shh/Gli patterning activity through the regulation of Gli3 expression. Development 135, 237-247 - PubMed
    1. Backman M., Machon O., Mygland L., van den Bout C. J., Zhong W., Taketo M. M., Krauss S. (2005). Effects of canonical Wnt signaling on dorso-ventral specification of the mouse telencephalon. Dev. Biol. 279, 155-168 - PubMed
    1. Bluske K. K., Kawakami Y., Koyano-Nakagawa N., Nakagawa Y. (2009). Differential activity of Wnt/beta-catenin signaling in the embryonic mouse thalamus. Dev. Dyn. 238, 3297-3309 - PMC - PubMed
    1. Brault V., Moore R., Kutsch S., Ishibashi M., Rowitch D. H., McMahon A. P., Sommer L., Boussadia O., Kemler R. (2001). Inactivation of the b-catenin gene by Wnt1-Cre-mediated deletion results in dramatic brain malformation and failure of craniofacial development. Development 128, 1253-1264 - PubMed

Publication types

LinkOut - more resources