. 2012 Jun 27;32(26):9073-88.
doi: 10.1523/JNEUROSCI.4968-11.2012.

Visual orientation and directional selectivity through thalamic synchrony

Affiliations

Visual orientation and directional selectivity through thalamic synchrony

Garrett B Stanley et al. J Neurosci. .

Abstract

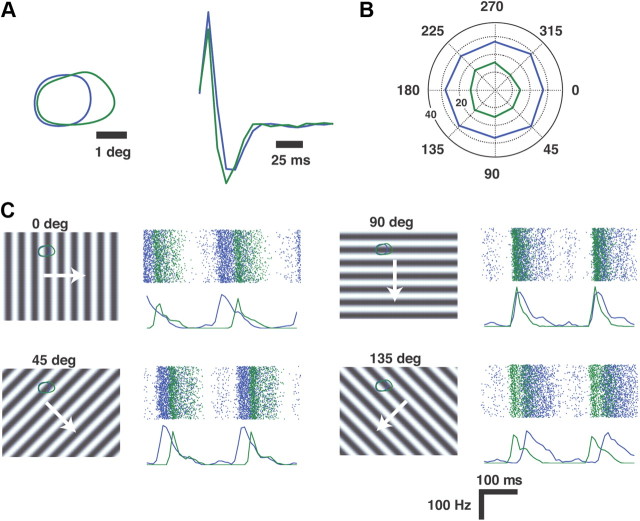
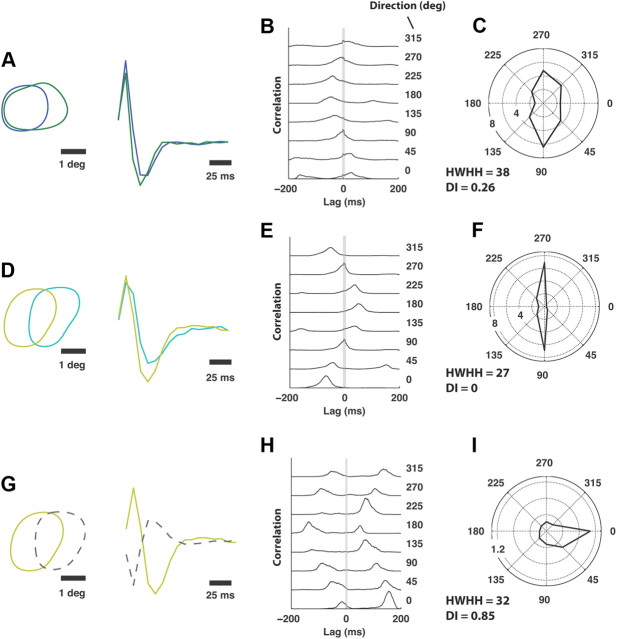
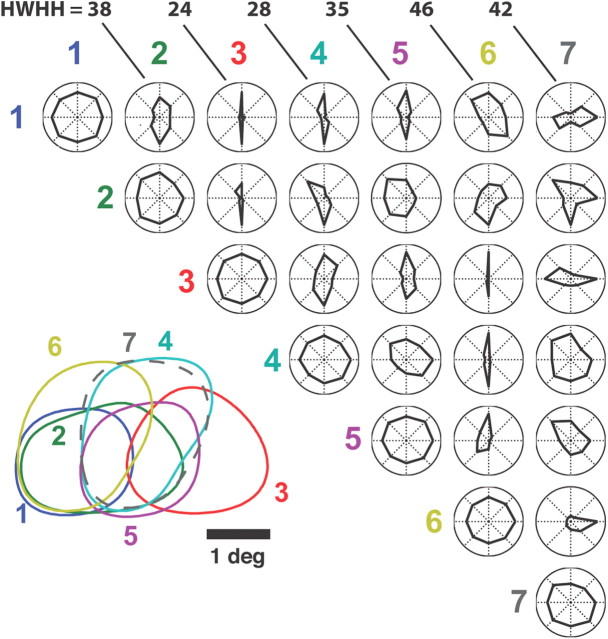
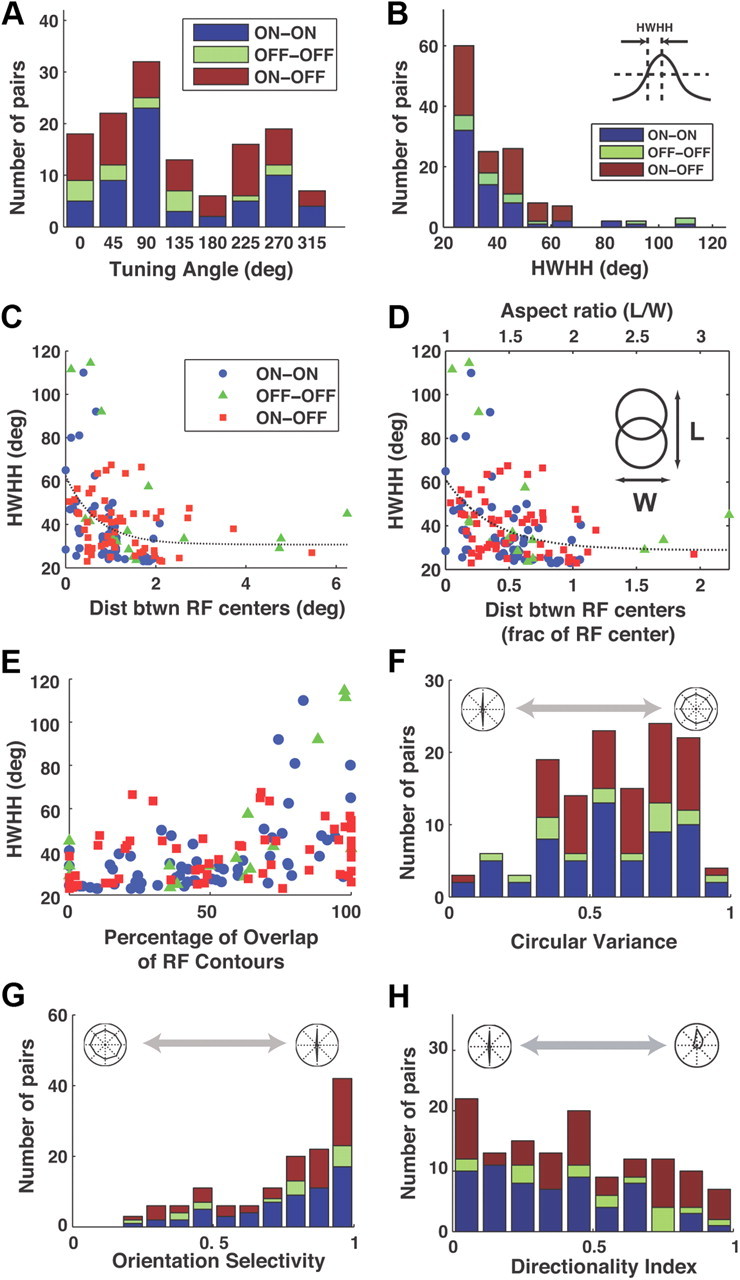
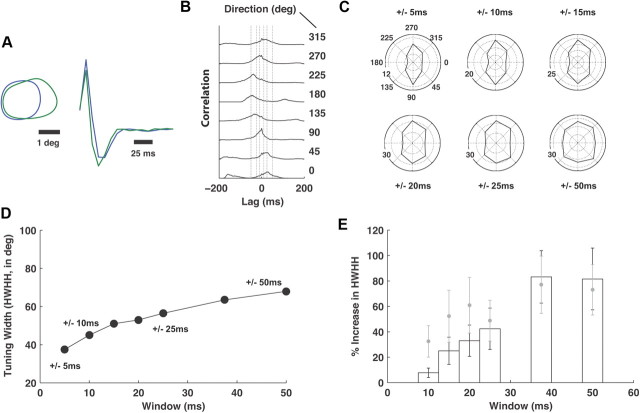
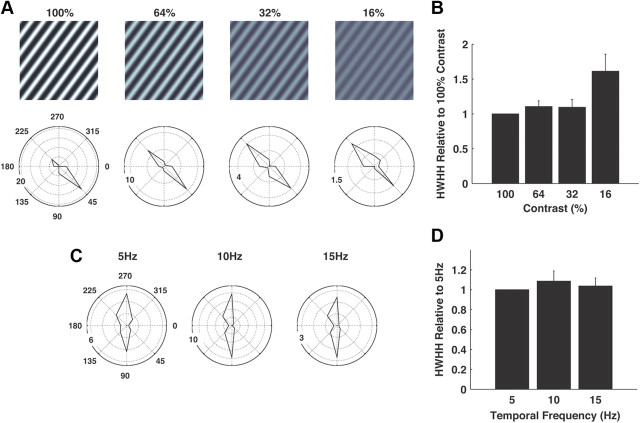
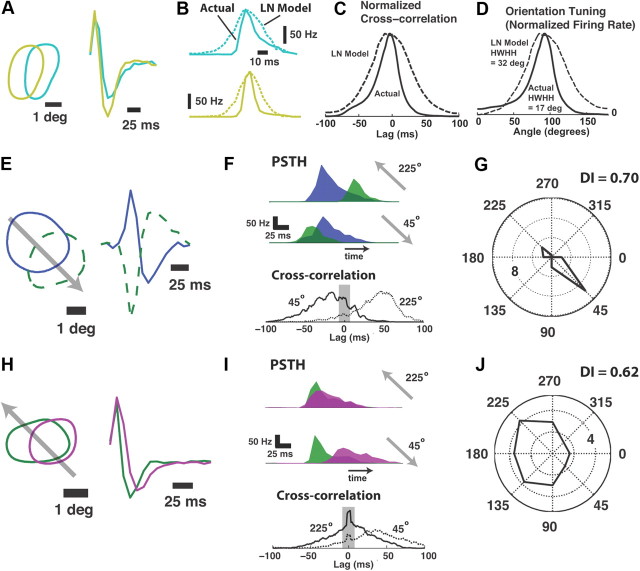
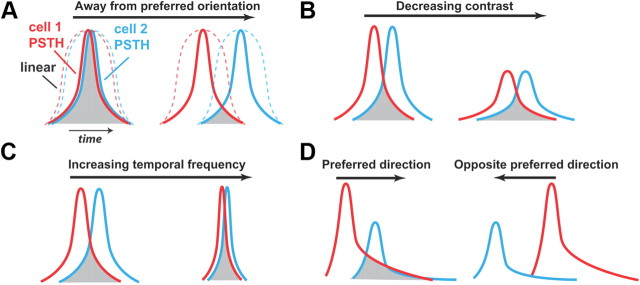
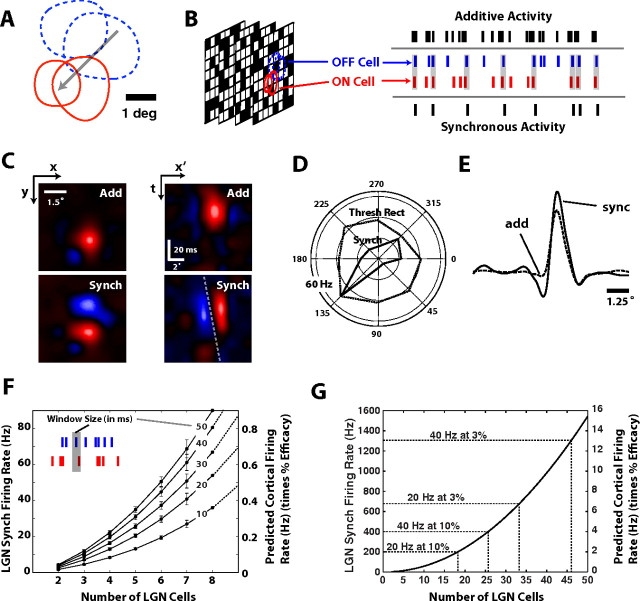
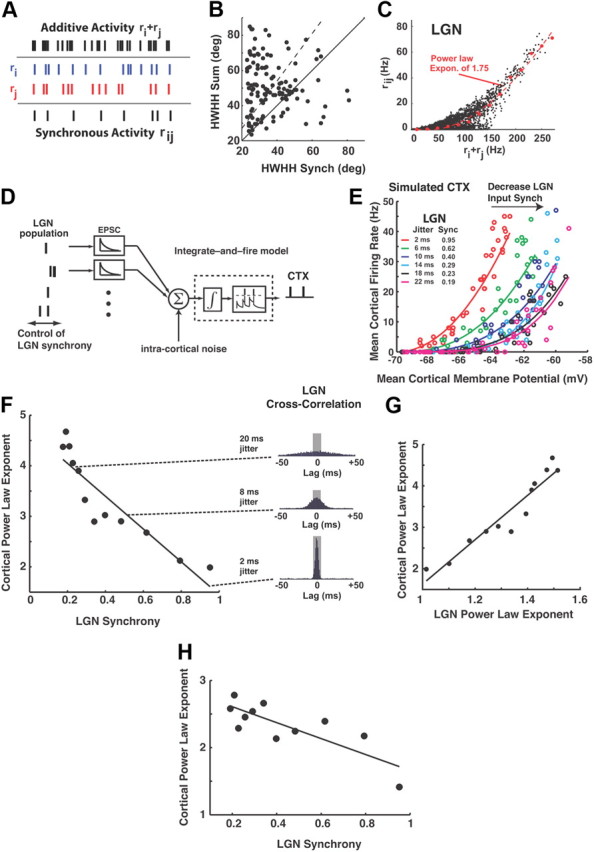
Thalamic neurons respond to visual scenes by generating synchronous spike trains on the timescale of 10-20 ms that are very effective at driving cortical targets. Here we demonstrate that this synchronous activity contains unexpectedly rich information about fundamental properties of visual stimuli. We report that the occurrence of synchronous firing of cat thalamic cells with highly overlapping receptive fields is strongly sensitive to the orientation and the direction of motion of the visual stimulus. We show that this stimulus selectivity is robust, remaining relatively unchanged under different contrasts and temporal frequencies (stimulus velocities). A computational analysis based on an integrate-and-fire model of the direct thalamic input to a layer 4 cortical cell reveals a strong correlation between the degree of thalamic synchrony and the nonlinear relationship between cortical membrane potential and the resultant firing rate. Together, these findings suggest a novel population code in the synchronous firing of neurons in the early visual pathway that could serve as the substrate for establishing cortical representations of the visual scene.


Figures

Figure 1.
Figure 1.
Geniculate response to drifting sinusoidal gratings. A, Spatial and temporal RF properties of two geniculate neurons recorded simultaneously. Maps were created from spatiotemporal white noise (see Materials and Methods). On the left are the 20% contours of the spatial RF at the peak latencies. On the right are the temporal kernels at the center of the RF. B, The mean firing rate as a function of the direction of drift of a sinusoidal grating across the RFs (spatial frequency of 0.5 cycle/degree, temporal frequency of 5 Hz). Radial axis represents firing rate, in Hz. C, Rasters and PSTHs for each of the neurons in response to the drifting grating in 4 of the 8 directions presented. The direction of drift for each case is illustrated to the left of each raster/PSTH. The bin size for the PSTH was 8 ms.
Figure 2.
Figure 2.
Example tuning properties derived from synchronous firing of pairs of neurons. A, Spatial and temporal RF properties for a particular ON-ON pair of LGN neurons. B, Spike cross-correlation for the pair as a function of the direction of the drifting grating. All correlograms were plotted with the same vertical scale across all orientations. Synchronous activity was defined as coincident activity of the two neurons within a time-window of ±5 ms, which is captured by the area under the cross-correlogram within the gray band in the figure. To the right of each panel is the associated angle of the drifting grating, in degrees. The blue and green cells of A had an average of 3392 and 1763 spikes per orientation, respectively. C, Synchronous firing rate as a function of direction. HWHH and directionality index (DI) corresponding to the polar plot are given. D–F, Same as A–C for a different ON-ON pair of geniculate cells. The aqua and yellow cells of D had an average of 2867 and 1915 spikes per orientation, respectively. G–I, Same as A–C for a different ON-OFF pair of geniculate cells. The yellow and gray cells of G had an average of 1915 and 1978 spikes per orientation, respectively.
Figure 3.
Figure 3.
Geniculate neuron pairs exhibit a diverse range of tuning properties. Shown in the lower left are the contours of the spatial RFs of 7 geniculate neurons recorded simultaneously, each represented by a different color and number. ON cells are represented by solid lines, OFF cells by dashed. The upper triangle shows the array of tuning properties for all pairwise combinations of cells. HWHH values in degrees are given for the polar plots in the top row.
Figure 4.
Figure 4.
Geniculate neuron pairs exhibit a diverse range of tuning properties. Sample consists of 24 ON cells and 14 OFF cells, resulting in 61 ON-ON pairs, 16 OFF-OFF pairs, and 56 ON-OFF pairs. Note that only cells recorded simultaneously were used to form pairs. A, Distribution of the angle associated with the peak pairwise firing rate. Pair types (ON-ON, OFF-OFF, and ON-OFF) are designated by the color scheme in the inset. B, The pairwise tuning widths in degrees, measured as the HWHH (defined in inset) of the peak in the tuning curve (ON-ON: 37 ± 18°, mean ± SD; OFF-OFF: 49 ± 30; ON-OFF: 39 ± 12). C, HWHH as a function of the absolute distance between RF centers. Dotted line is exponential fit to all data of form y = α + βexp(−x/γ), where α = 30°, β = 33°, γ = 0.7°. D, HWHH as a function of the fractional distance between RF centers, where distance is measured relative to the size of the RF center (see Materials and Methods). Dotted line is exponential fit to all data of form y = α + βexp(−x/γ), where α = 29°, β = 33°, γ = 0.4°. Shown along the top axis is the corresponding aspect ratio, defined as the length of the RF tiling to the width, as illustrated in the inset. This measure assumes that each of the two RFs has a diameter equal to the average of the two actual RFs. E, HWHH as a function of the percentage of overlap between the RFs, defined as the ratio of the area of the intersection of the contours to the area of the smaller of the two contours, multiplied by 100%. F, Circular variance, as a measure of orientation tuning of the pair of neurons. Measure indicates strong orientation tuning as it tends to 0, and no orientation preference as it tends to 1 (ON-ON: 0.56 ± 0.24, mean ± SD; OFF-OFF: 0.57 ± 0.24; ON-OFF: 0.61 ± 0.19). G, Orientation selectivity of the pairs of neurons. Measure indicates strong orientation tuning as it tends to 1, and no orientation tuning as it tends to 0 (ON-ON: 0.77 ± 0.2, mean ± SD; OFF-OFF: 0.73 ± 0.28; ON-OFF: 0.72 ± 0.26). H, Directionality index as a measure of how strongly directionally tuned the pair is. Measure indicates strong directional tuning as it tends to 1, and no directional tuning as it tends to 0 (ON-ON: 0.36 ± 0.25, mean ± SD; OFF-OFF: 0.53 ± 0.28; ON-OFF: 0.50 ± 0.31).
Figure 5.
Figure 5.
Effect of varying synchrony window. A, Spatial and temporal RF properties for an example pair, as in previous figures. B, Cross-correlation function for different directions of the drifting gratings. Vertical lines define windows of ±10, 25, and 50 ms. The blue and green cells of A had an average of 3392 and 1763 spikes per orientation, respectively. C, Joint tuning as a function of the window width (indicated above each polar plot). The radial scale shown in Hz. D, HWHH, in degrees, as a function of window width in milliseconds for the example pair in A–C. E, Percentage increase in the tuning width (HWHH) as a function of window width, relative to the HWHH corresponding to a ±5 ms window. Bars are the mean and the SEM, for 21 neuron pairs. In gray are the mean (symbols) and SEM (bars) of the tuning widths for the analysis at each window size, while excluding synchronous spiking within smaller windows (see Results).
Figure 6.
Figure 6.
Invariant properties of thalamic synchrony. A, Shown are the polar plots of the joint tuning properties for a typical ON-OFF pair at different contrasts (100%, 64%, 32%, and 16%). Shown above are the corresponding grating stimuli. The window width defining synchrony was ±5 ms. Radial scale indicates firing rate in Hz. B, Summary statistics across 15 neuron pairs. Plotted is the HWHH at different contrasts normalized by the HWHH at 100% contrast (mean ± SEM). C, Shown are the polar plots of the joint tuning properties for a typical ON-ON pair at different temporal frequencies (5, 10, and 15 Hz, corresponding to 10, 20, and 30°/s). The window width defining synchrony was ±5 ms. Radial scale indicates firing rate in Hz. D, Summary statistics across 21 neuron pairs. Plotted is the HWHH at different temporal frequencies normalized by the HWHH at 5 Hz (mean ± SEM).
Figure 7.
Figure 7.
Tuning properties result from precise timing properties of LGN firing. A, Spatial and temporal receptive field properties for an example ON-ON pair. B, PSTHs of the actual firing activity of each neuron (solid) and PSTH predicted from the LN model (dashed), in response to a drifting sinusoidal grating (0.5 cycle/degree, 5 Hz, at preferred orientation for synchronous firing of 90°). C, Spike cross-correlation function for the actual (solid) and LN model predicted (dashed) activity in response to a drifting sinusoidal grating (0.5 cycle/degree, 5 Hz) in the direction (90°) eliciting the strongest synchronous activity, normalized to the peak correlation for comparison of the temporal structure of the correlation. D, Actual (solid) and LN model predicted (dashed) tuning curves, normalized to the peak firing rate for comparison of the sharpness of the tuning for the two cases. HWHH for the LN model prediction was nearly double that of the experimental data. E, Spatial and temporal RF properties for an example ON-OFF pair. F, Superimposed PSTHs of each neuron at 45 and 225° (top), and corresponding spike cross-correlograms for each direction (bottom, solid 45°, dashed 225°). Gray region highlights relative proportion of synchronous firing falling within a ±5 ms window. G, Joint tuning of the synchronous activity of the pair in a ±5 ms window. The radial axis is firing rate, in Hz. H, Spatial and temporal RF properties for an example ON-ON pair. I, J, Same as in F and G.
Figure 8.
Figure 8.
Heuristics of relationship between spike timing and tuning properties. Shown are diagrams of PSTHs of two hypothetical neurons in response to various stimulus manipulations. A, The overlap between the PSTHs of two neurons (cell 1 in red, cell 2 in blue) decreases as the angle of stimulus orientation varies from the preferred angle (left to right), where the degree of overlap (shaded gray) illustrates the resultant synchronous activity. The corresponding synchronous activity from linear response (dashed) falls off much more gradually. B, With decreasing contrast, the degree to which the responses overlap, and thus the synchronous activity, remains relatively unchanged, resulting in the observed contrast invariance. C, For a given orientation, the relative time difference between the peak of activity of the two neurons decreases with increasing temporal frequency or speed of the stimulus. However, with increasing temporal frequency, the timing of the firing of each becomes more precise, offsetting this effect, resulting in a synchronous activity that is relatively invariant to temporal frequency. Note that for display purposes a moderate degree of synchrony is shown to exaggerate this effect, but this argument holds more generally for strong synchronous activity at the preferred orientation. D, Disparities in the absolute latencies in the responses and temporal asymmetries of the PSTHs of the two neurons leads to asymmetries in the overlap and thus the synchronous activity for motion in opposite directions.
Figure 9.
Figure 9.
Construction of the cortical receptive field. A, Shown are the RFs of 4 geniculate cells, collectively aligned in a cortical cell-like RF. B, Geniculate responses to spatiotemporal white noise stimulus combined in an additive and synchronous manner (see Results). C, RFs from the spike-triggered average stimulus, for spatial (left) and space-time (right) representations. For each, top image shows the representation for an additive combination of LGN spiking, whereas the bottom image shows that for the synchronous activity (see Results). Dashed line in space-time plot indicates tilt in the x-t plane, indicative of direction selectivity. D, Tuning curves from analogous combinations of responses to drifting sinusoidal gratings (0.5 cycle/degree, 5 Hz) in different directions. The additive activity was threshold-rectified, matching the peak firing rate of the synchronous activity. E, One-dimensional “slice” of spatial RF for additive (solid) and synchronous (dashed) cases, illustrating the enhanced flanking subregion for synchronous activity. F, Firing rate of the synchronous activity averaged across 8 combinations of geniculate cells similar to that in A, while systematically varying the number of cells included. Right axis shows the predicted cortical firing rate in Hz (when multiplied by assumed efficacy, in %). G, Projected relationship between number of LGN cells and LGN synchronous firing rate (left axis) and predicted cortical firing rate (right axis). Dashed lines indicate numbers of LGN cells required for cortical firing rates of 20 and 40 Hz, at efficacies of 3 and 10%.
Figure 10.
Figure 10.
Thalamic synchrony and the nonlinearity of cortical spike generation. A, Geniculate responses to drifting sinusoidal gratings combined in an additive and synchronous manner (see Results). B, The HWHH for the synchronous activity of each pair versus the HWHH of the sum (35% broader tuning, p < 0.001, n = 133). Solid line is unity slope line; dashed line is linear regression. C, Plotted is the instantaneous firing rate of the linearly summed activity of the two neurons ri and rj, versus the corresponding value of the instantaneous firing rate of the hypothetical neuron representing the synchronous activity of the pair, rij. Each point in the scatter represents one point in time. The larger (red) symbols represent the average synchronous firing rate in a 20 Hz bin, and the curve is a power-law fit of the form A[ri + rj + φ]p, where A = 0.006, φ = 42, p = 1.75. D, The spiking activity from a simulated population of LGN neurons was used as the input to an integrate-and-fire model of the cortical response. Firing of an LGN input generates an EPSC, the sum of which is integrated in the model to affect the cortical membrane potential. Upon crossing a threshold, the model cortical cell fires a spike, then resets. The synchrony of the LGN input to the model was systematically controlled (see Materials and Methods). E, The mean cortical firing rate exhibits a power law relationship with the underlying mean cortical membrane potential of the form A[Vm]p, where A is a proportionality constant and p is the exponent. The nonlinearity of the relationship becomes more dramatic with increasing LGN timing jitter (or decreasing LGN synchrony). F, The power law exponent of the relationship in E is strongly negatively correlated with LGN synchrony (slope = −3.2, r2 = 0.83, p < 0.001). Shown to the right are LGN spike cross-correlation functions at different degrees of jitter (and synchrony). G, The exponent of the power-law relating additive and synchronous thalamic activity in C is strongly predictive of the exponent of the power law relating cortical membrane potential to cortical firing rate (slope = 5.3, r2 = 0.91, p < 0.001). H, For experimentally measured LGN spiking as input to the model, the LGN synchrony was again strongly predictive of the cortical power law exponent (slope = −1.2, r2 = 0.64, p < 0.001).

Similar articles

Cited by

References

    1. Alonso JM, Martinez LM. Functional connectivity between simple cells and complex cells in cat striate cortex. Nat Neurosci. 1998;1:395–403. - PubMed
    1. Alonso JM, Usrey WM, Reid RC. Precisely correlated firing in cells of the lateral geniculate nucleus. Nature. 1996;383:815–819. - PubMed
    1. Alonso JM, Usrey WM, Reid RC. Rules of connectivity between geniculate cells and simple cells in cat primary visual cortex. J Neurosci. 2001;21:4002–4015. - PMC - PubMed
    1. Anderson JS, Lampl I, Gillespie DC, Ferster D. The contribution of noise to contrast invariance of orientation tuning in cat visual cortex. Science. 2000;290:1968–1972. - PubMed
    1. Andolina IM, Jones HE, Wang W, Sillito AM. Corticothalamic feedback enhances stimulus response precision in the visual system. Proc Natl Acad Sci U S A. 2007;104:1685–1690. - PMC - PubMed

Publication types

LinkOut - more resources