. 2012 Jun 27;32(26):9089-102.
doi: 10.1523/JNEUROSCI.5685-11.2012.

A temporal bottleneck in the language comprehension network

Affiliations

A temporal bottleneck in the language comprehension network

Laurianne Vagharchakian et al. J Neurosci. .

Abstract

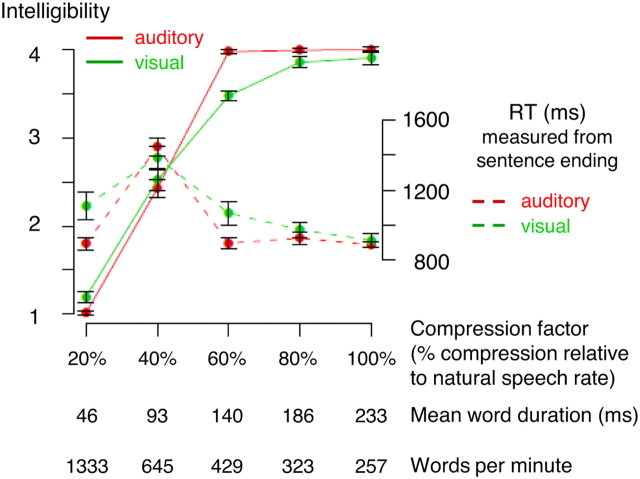
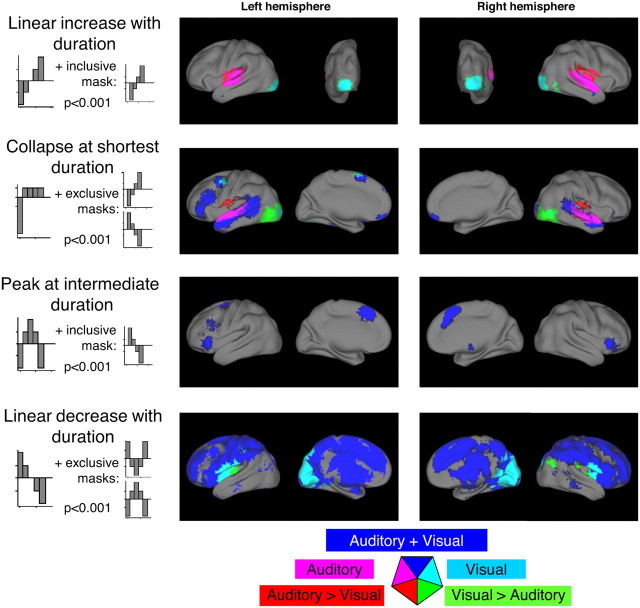
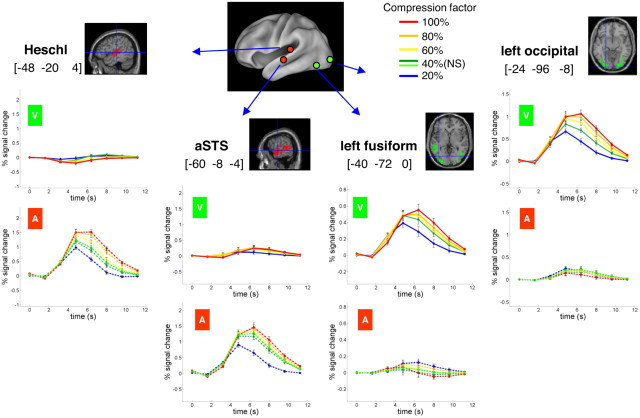
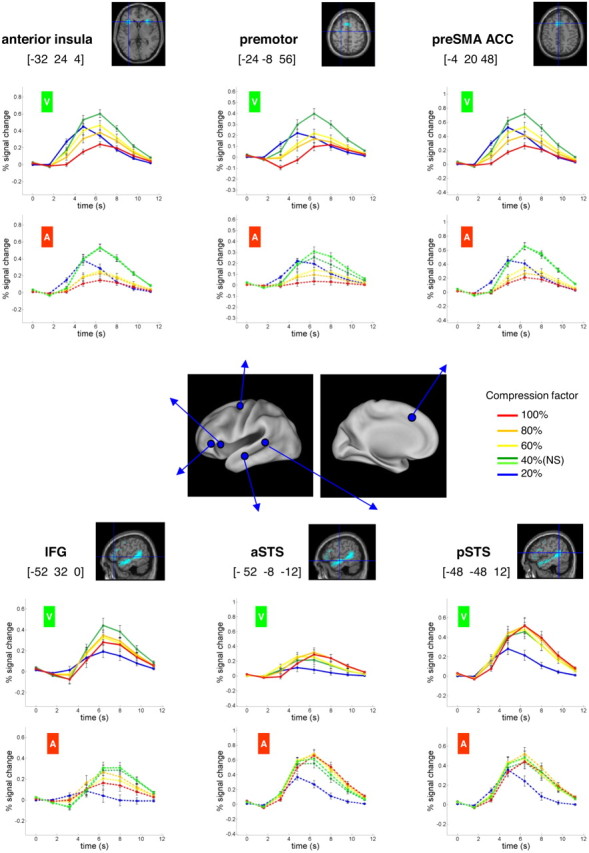
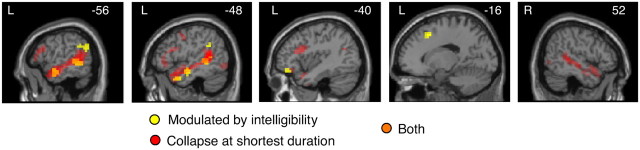
Humans can understand spoken or written sentences presented at extremely fast rates of ∼400 wpm, far exceeding the normal speech rate (∼150 wpm). How does the brain cope with speeded language? And what processing bottlenecks eventually make language incomprehensible above a certain presentation rate? We used time-resolved fMRI to probe the brain responses to spoken and written sentences presented at five compression rates, ranging from intelligible (60-100% of the natural duration) to challenging (40%) and unintelligible (20%). The results show that cortical areas differ sharply in their activation speed and amplitude. In modality-specific sensory areas, activation varies linearly with stimulus duration. However, a large modality-independent left-hemispheric language network, including the inferior frontal gyrus (pars orbitalis and triangularis) and the superior temporal sulcus, shows a remarkably time-invariant response, followed by a sudden collapse for unintelligible stimuli. Finally, linear and nonlinear responses, reflecting a greater effort as compression increases, are seen at various prefrontal and parietal sites. We show that these profiles fit with a simple model according to which the higher stages of language processing operate at a fixed speed and thus impose a temporal bottleneck on sentence comprehension. At presentation rates faster than this internal processing speed, incoming words must be buffered, and intelligibility vanishes when buffer storage and retrieval operations are saturated. Based on their temporal and amplitude profiles, buffer regions can be identified with the left inferior frontal/anterior insula, precentral cortex, and mesial frontal cortex.


Figures

Figure 1.
Figure 1.
Behavioral results during fMRI acquisition. Intelligibility score (left axis and solid line) and reaction time measured from the end of the sentence (right axis and dotted line) are plotted as a function of the compression factor (for convenience, this value is also converted to mean word duration and word rate). Intelligibility was subjectively rated using a four-button press, specified as follows: 1, nothing understood; 2, weakly understood; 3, mostly understood; 4, completely understood. Each point was averaged over 20 items per conditions and per subject (bars indicate 1 SE). Red, Auditory modality; Green, visual modality.
Figure 2.
Figure 2.
Classification of regions exhibiting a significant modulation of activation amplitude with compression rate (p < 0.001). Blue, Main effect across both written and spoken sentences. Green and red, Interaction terms indicating a significantly greater effect for written sentences (green) or for spoken sentences (red). First row, Lateral and posterior maps showing areas with a linear increase of activation as a function of the five compression factors (20, 40, 60, 80, or 100% of natural speech rate: linear contrast [−2 −1 0 1 2] inclusively masked by [0 −3 −1 1 3]). Second row, Lateral and medial maps showing areas with a collapse of activation at the shortest stimulus duration (nonlinear contrast [−4 1 1 1 1] exclusively masked by [0 3 1 −1 −3] and [0 −3 −1 1 3]). Third row, Lateral and medial maps showing areas with a maximum of activation for intermediate compression factors (quadratic contrast [−2 1 2 1 −2] inclusively masked by [0 3 1 −1 −3]). Fourth row, Lateral and medial maps showing areas with a linear increase in activation as the compression factor gets shorter (linear contrast [2 1 0 −1 −2] exclusively masked by [−2 1 2 1 −2] and by [2 −1 −2 −1 2]).
Figure 3.
Figure 3.
Time course of fMRI responses in modality-specific areas showing an increase of activation as a function of stimulus duration. Each ROI was defined as a sphere of 10 mm radius centered on the peak of the main effect reported in Table 1. Each panel shows the responses to written sentences (top, green V) and to spoken sentences (top, red A). Curve color indicates compression rate, with the warmest colors representing the slowest rates of sentence presentation (up to 100% compression factor = natural speech rate) and the coldest colors the fastest rates (down to 20% of original stimuli). For the auditory modality, the data are plotted separately for the two conditions at 40% compression factor (dark green, 40%N; light green, 40%S; see Materials and Methods). Sensory areas in occipital and Heschl's gyrus present a purely linear effect of duration. Left fusiform and aSTS regions, although presenting a superficially similar time course, exhibit a significant nonlinear component (interaction of modality with the nonlinear contrast [−4 1 1 1 1] exclusively masked by [0 3 1 −1 −3] and [0 −3 −1 1 3]; see Table 2).
Figure 4.
Figure 4.
Time course of fMRI responses in regions exhibiting a nonlinear profile of activation as function of stimulus duration. Top, Regions showing a maximum of activation for intermediate compression factors (contrast [−2 1 2 1 −2] inclusively masked by [0 3 1 −1 −3]). Bottom, Regions exhibiting a collapse of activation at the fastest compression rate (20%) and a constant activation across all other compression factors (contrast [−4 1 1 1 1] exclusively masked with the two following contrasts [0 3 1 −1 −3] and [0 −3 −1 1 3]). Note that all these regions showed amodal profiles of activations similar in auditory (red A) and visual (green V) modalities.
Figure 5.
Figure 5.
Regions modulated by subjective intelligibility. Yellow, Regions in which activation amplitude was significantly correlated with subjective ratings of intelligibility for sentences presented at 40% compression rate (where intelligibility varied the most across trials). In the STS, most of these regions overlapped with regions showing a nonlinear activation across compression factors (red voxel). The intersection of the two contrasts appears in orange.
Figure 6.
Figure 6.
Schematic model of a temporal bottleneck during sentence integration. The model assumes that the integration of successive words into a unified syntactic and semantic structure proceeds at a relatively fixed pace (gray boxes within each panel). Incoming words have to be temporarily stored in a buffer, here assumed to decay exponentially, before being transmitted to the sentence integration stage. A, When words are presented at a slow rate, buffer storage and retrieval proceeds without any difficulty as only one word, or just a few, is waiting at any given moment. B, When words are presented at a fast rate, however, they pile up in the buffer, thus complicating their retrieval. Note that the least recent word must be selectively retrieved (“first in, first out” principle). We assume that buffer retrieval collapses totally once the number of buffered words exceeds a certain value.
Figure 7.
Figure 7.
fMRI activation patterns predicted by the bottleneck model. A, Schematic depiction of the amount of processing required by a 12-word sentence presented at three different paces (rows: slow, intermediate, fast) at each of the three different stages of the proposed model (columns: sensory, buffer, integration). B, Predicted time course of fMRI responses predicted by computer simulations at each of these stages, as the compression factor is varied from 20 to 100%. The simulated curves can be directly compared with the experimental data in Figures 3 and 4.
Figure 8.
Figure 8.
Predicted and observed phases of the fMRI activation as a function of sentence duration. Left, Quantitative theoretical predictions for the three types of regions postulated in the model (sensory, buffer, integration). The phases in seconds were estimated by fitting a sinusoidal function of the time courses presented in Figure 7. Middle and right, Observed fMRI phases in the left hemisphere, separately for the auditory and visual modalities. All ROIs located in the left hemisphere and reported in Table 1 were averaged together, separately for the three types of regions defined by the SPM contrasts in Figure 1 and Table 1.

Similar articles

Cited by

References

    1. Adank P, Devlin JT. On-line plasticity in spoken sentence comprehension: adapting to time-compressed speech. Neuroimage. 2010;49:1124–1132. - PMC - PubMed
    1. Altmann GT, Mirković J. Incrementality and prediction in human sentence processing. Cogn Sci. 2009;33:583–609. - PMC - PubMed
    1. Binder JR, Rao SM, Hammeke TA, Frost JA, Bandettini PA, Hyde JS. Effects of stimulus rate on signal response during functional magnetic resonance imaging of auditory cortex. Brain Res Cogn Brain Res. 1994;2:31–38. - PubMed
    1. Brauer J, Neumann J, Friederici AD. Temporal dynamics of perisylvian activation during language processing in children and adults. Neuroimage. 2008;41:1484–1492. - PMC - PubMed
    1. Brennan J, Nir Y, Hasson U, Malach R, Heeger DJ, Pylkkänen L. Syntactic structure building in the anterior temporal lobe during natural story listening. Brain Lang. 2012;120:163–173. - PMC - PubMed

Publication types

MeSH terms