

Listen to genes: dealing with microarray data in the frequency domain
- PMID: 22745650
- PMCID: PMC3383793
- DOI: 10.1371/journal.pone.0005098
Listen to genes: dealing with microarray data in the frequency domain
Abstract
Background: We present a novel and systematic approach to analyze temporal microarray data. The approach includes normalization, clustering and network analysis of genes.
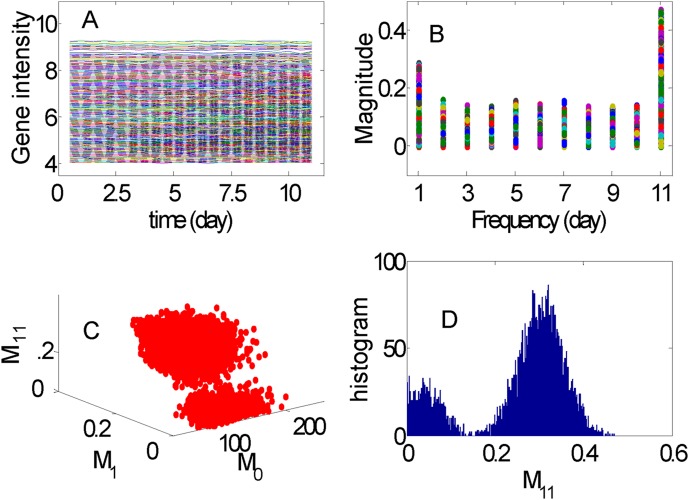
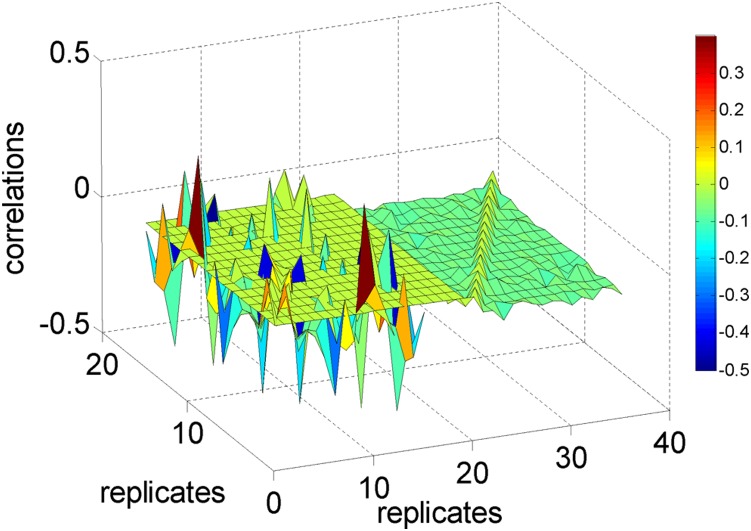
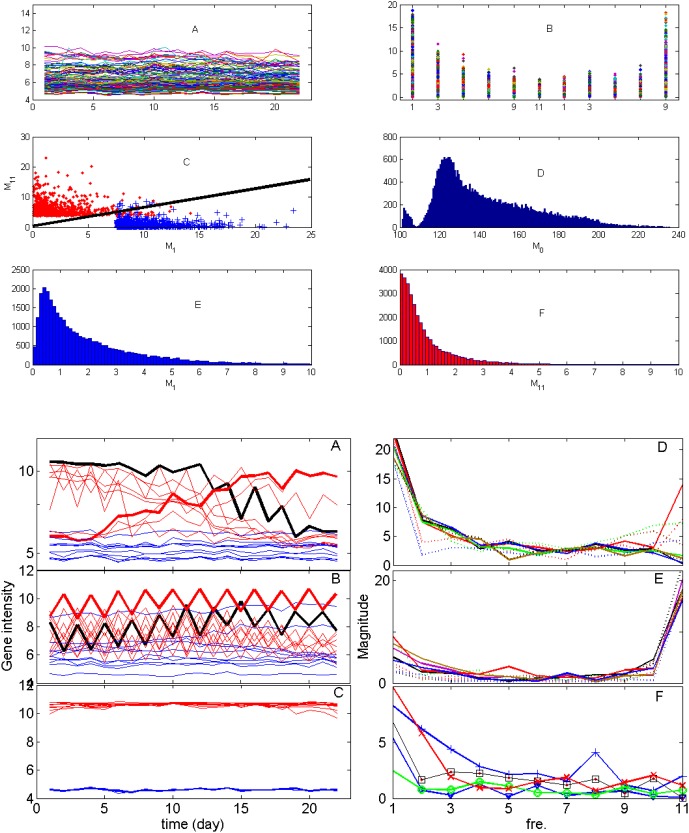
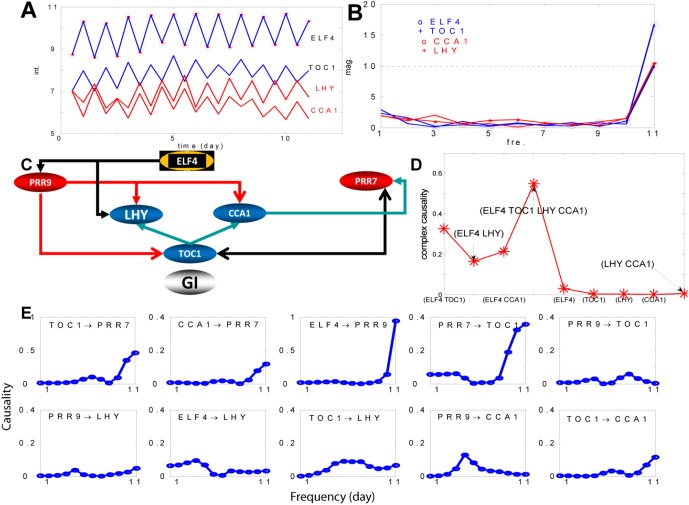
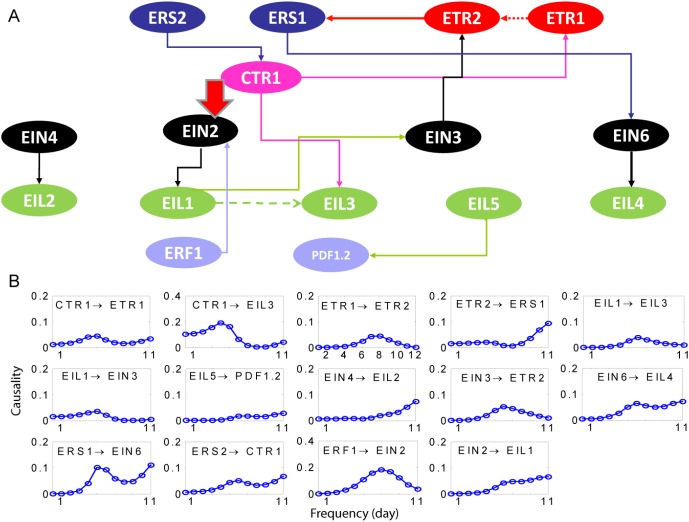
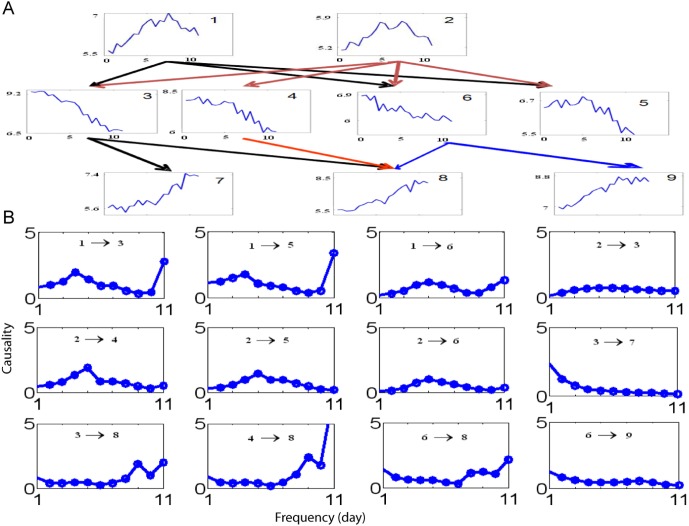
Methodology: Genes are normalized using an error model based uniform normalization method aimed at identifying and estimating the sources of variations. The model minimizes the correlation among error terms across replicates. The normalized gene expressions are then clustered in terms of their power spectrum density. The method of complex Granger causality is introduced to reveal interactions between sets of genes. Complex Granger causality along with partial Granger causality is applied in both time and frequency domains to selected as well as all the genes to reveal the interesting networks of interactions. The approach is successfully applied to Arabidopsis leaf microarray data generated from 31,000 genes observed over 22 time points over 22 days. Three circuits: a circadian gene circuit, an ethylene circuit and a new global circuit showing a hierarchical structure to determine the initiators of leaf senescence are analyzed in detail.
Conclusions: We use a totally data-driven approach to form biological hypothesis. Clustering using the power-spectrum analysis helps us identify genes of potential interest. Their dynamics can be captured accurately in the time and frequency domain using the methods of complex and partial Granger causality. With the rise in availability of temporal microarray data, such methods can be useful tools in uncovering the hidden biological interactions. We show our method in a step by step manner with help of toy models as well as a real biological dataset. We also analyse three distinct gene circuits of potential interest to Arabidopsis researchers.
Conflict of interest statement
Figures
Similar articles
-
A temporal precedence based clustering method for gene expression microarray data.BMC Bioinformatics. 2010 Jan 30;11:68. doi: 10.1186/1471-2105-11-68. BMC Bioinformatics. 2010. PMID: 20113513 Free PMC article.
-
Inferring transcriptional gene regulation network of starch metabolism in Arabidopsis thaliana leaves using graphical Gaussian model.BMC Syst Biol. 2012 Aug 16;6:100. doi: 10.1186/1752-0509-6-100. BMC Syst Biol. 2012. PMID: 22898356 Free PMC article.
-
Impact of environmental inputs on reverse-engineering approach to network structures.BMC Syst Biol. 2009 Dec 4;3:113. doi: 10.1186/1752-0509-3-113. BMC Syst Biol. 2009. PMID: 19961587 Free PMC article.
-
Molecular genetics of leaf senescence in Arabidopsis.Trends Plant Sci. 2003 Jun;8(6):272-8. doi: 10.1016/S1360-1385(03)00103-1. Trends Plant Sci. 2003. PMID: 12818661 Review.
-
Folic acid supplementation and malaria susceptibility and severity among people taking antifolate antimalarial drugs in endemic areas.Cochrane Database Syst Rev. 2022 Feb 1;2(2022):CD014217. doi: 10.1002/14651858.CD014217. Cochrane Database Syst Rev. 2022. PMID: 36321557 Free PMC article.
Cited by
-
A novel extended Granger Causal Model approach demonstrates brain hemispheric differences during face recognition learning.PLoS Comput Biol. 2009 Nov;5(11):e1000570. doi: 10.1371/journal.pcbi.1000570. Epub 2009 Nov 20. PLoS Comput Biol. 2009. PMID: 19936225 Free PMC article.
-
A temporal precedence based clustering method for gene expression microarray data.BMC Bioinformatics. 2010 Jan 30;11:68. doi: 10.1186/1471-2105-11-68. BMC Bioinformatics. 2010. PMID: 20113513 Free PMC article.
-
Identifying interactions in the time and frequency domains in local and global networks - A Granger Causality Approach.BMC Bioinformatics. 2010 Jun 21;11:337. doi: 10.1186/1471-2105-11-337. BMC Bioinformatics. 2010. PMID: 20565962 Free PMC article.
References
-
- Wichert S, Fokianos K, Strimmer K. Identifying periodically expressed transcripts in microarray time series data. Bioinformatics. 2004;20:5–20. - PubMed
-
- Kim B-R, Littell RC, Wu RL. Clustering the periodic pattern of gene expression using Fourier series approximations. Curr Genomics. 2006;7:197203.
-
- Claridge-Chang A, Wijnen H, Naef F, Boothroyd C, Rajewsky N, et al. Circadian regulation of gene expression systems in the Drosophila head. Neuron. 2001;32:657–671. - PubMed
-
- Harmer SL, Hogenesch JB, Straume M, Chang HS, Han B, et al. Orchestrated transcription of key pathways in Arabidopsis by the circadian clock. Science. 2000;290:21102113. - PubMed
Publication types
MeSH terms
Substances
Grants and funding
LinkOut - more resources
Full Text Sources
