

Selective heterogeneity in exoprotease production by Bacillus subtilis
- PMID: 22745669
- PMCID: PMC3380070
- DOI: 10.1371/journal.pone.0038574
Selective heterogeneity in exoprotease production by Bacillus subtilis
Abstract
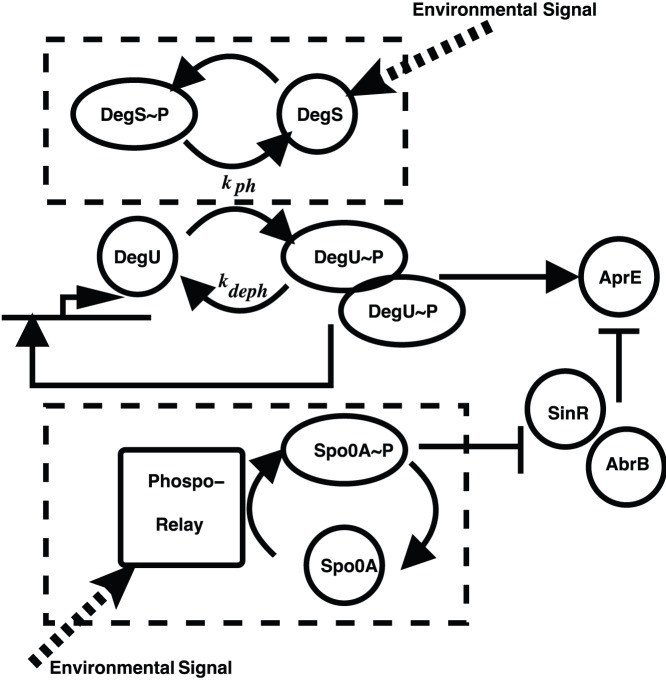
Bacteria have elaborate signalling mechanisms to ensure a behavioural response that is most likely to enhance survival in a changing environment. It is becoming increasingly apparent that as part of this response, bacteria are capable of cell differentiation and can generate multiple, mutually exclusive co-existing cell states. These cell states are often associated with multicellular processes that bring benefit to the community as a whole but which may be, paradoxically, disadvantageous to an individual subpopulation. How this process of cell differentiation is controlled is intriguing and remains a largely open question. In this paper, we consider an important aspect of cell differentiation that is known to occur in the gram-positive bacterium Bacillus subtilis: we investigate the role of two master regulators DegU and Spo0A in the control of extra-cellular protease production. Recent work in this area focussed the on role of DegU in this process and suggested that transient effects in protein production were the drivers of cell-response heterogeneity. Here, using a combination of mathematical modelling, analysis and stochastic simulations, we provide a complementary analysis of this regulatory system that investigates the roles of both DegU and Spo0A in extra-cellular protease production. In doing so, we present a mechanism for bimodality, or system heterogeneity, without the need for a bistable switch in the underlying regulatory network. Moreover, our analysis leads us to conclude that this heterogeneity is in fact a persistent, stable feature. Our results suggest that system response is divided into three zones: low and high signal levels induce a unimodal or undifferentiated response from the cell population with all cells OFF and ON, respectively for exoprotease production. However, for intermediate levels of signal, a heterogeneous response is predicted with a spread of activity levels, representing typical "bet-hedging" behaviour.
Conflict of interest statement
Figures
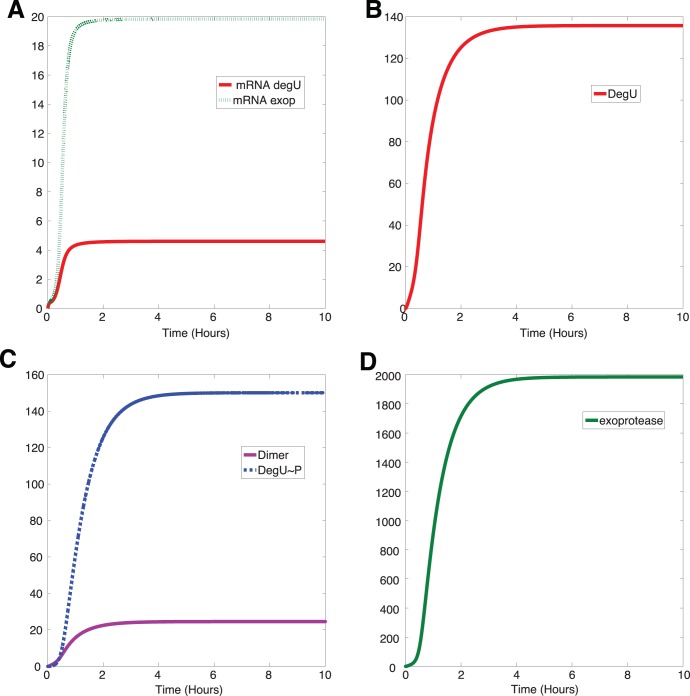
 P and dimer of DegU
 P and (D) exoprotease. All parameters as in Table 1.
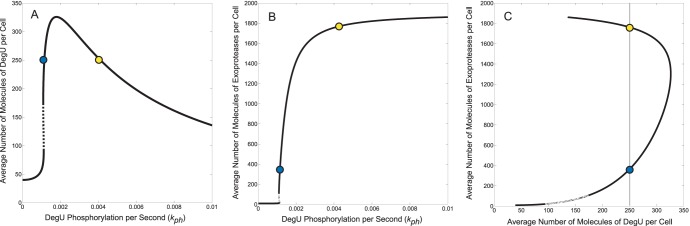
 (DegU) and (B)
  (exoprotease) of system (1)–(6) as functions of
  . (C) Plot of DegU versus the level of exoprotease (
 versus
  ). Solid lines represents stable solutions, dashed lines represent unstable solutions and a region of bistability. The blue and yellow dots individually indicate system output for two different values of
  . They are provided for ease of comparison between the graphs (see text). All parameter values from Table 1.
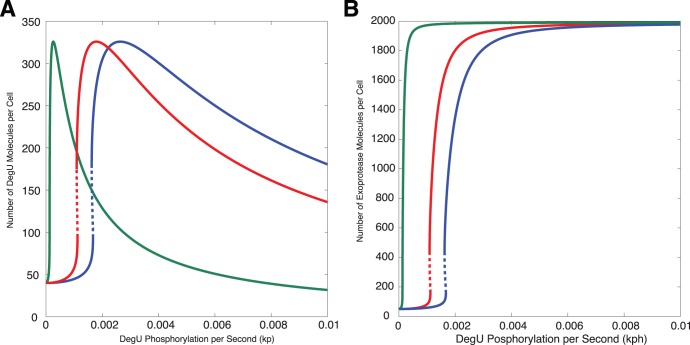
 (DegU) and (B)
  (exoprotease) of the full system (1)–(6) as functions of
  . Solid lines represent stable solutions, dashed lines represent unstable solutions and a region of bistability. All parameter values from Table 1 except
  (green);
  (red);
  (blue).
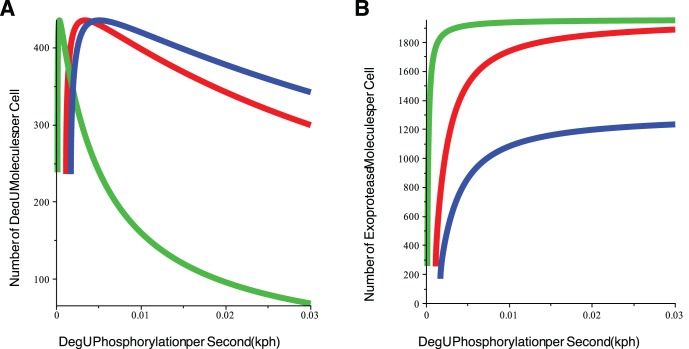
 (DegU) and (B)
  (exoprotease - computed using (S7)–(S9)) as functions of
  . In each figure, all parameter values from Table 1 except
  (green);
  (red);
  (blue).
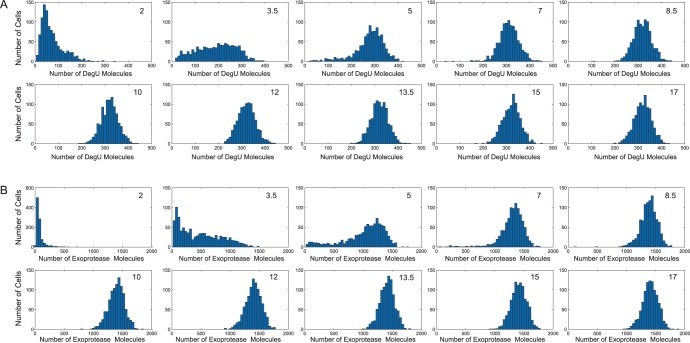
 hrs. All parameter values from Table 1 except
  . Initial protein values set to zero.
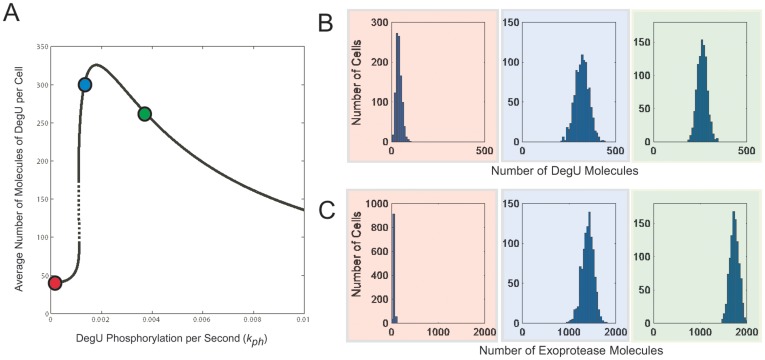
 values indicated by the red, blue and green dots, respectively, are shown in (A). Histograms show the levels of: (B) DegU and (C) exoprotease collated from 1000 simulations at
  hours. All parameter values from Table 1 except in A, B and C red indicates
  ; blue indicates
  and green indicates
  . Initial values set to correspond to the equivalent deterministic steady state.
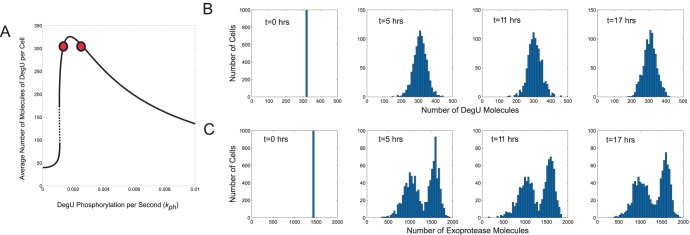
 values indicated by the red dots is shown in (A). Histograms show the levels of (B) DegU and (C) exoprotease collated from 1000 simulations at 4 time points. All parameter values from Table 1 except for each simulation,
  was selected randomly from the values
  . Initial values of the variables set to correspond to the deterministic steady state for
  .
.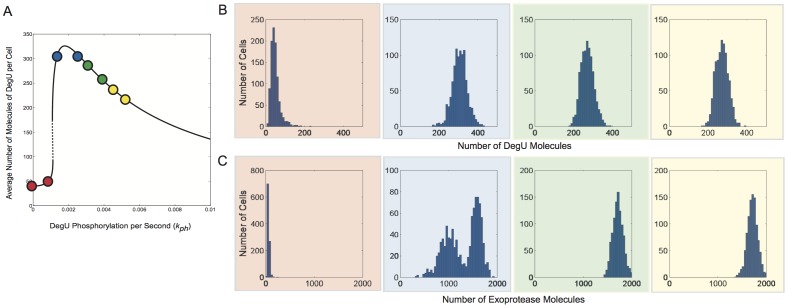
 values indicated by the red, blue, green and yellow dots, respectively, are shown in (A). Histograms show the levels of (B) DegU and (C) exoprotease collated from 1000 simulations at
  hours. All parameter values from Table 1 except for each simulation,
  was selected randomly from the values:
  (red);
  (blue);
  (green);
  (yellow). Initial levels set to correspond to the deterministic steady state associated with the midpoint values.
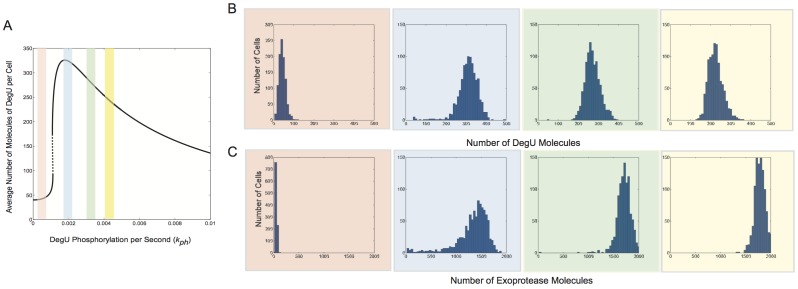
 values indicated by the red, blue, green and yellow bands, respectively, are shown in (A). Histograms show the levels of (B) DegU and (C) exoprotease collated from 1000 simulations at
  hours. All parameter values from Table 1 except for each simulation,
  was selected from normally distributed values with mean values
  (red);
  (blue);
  (green);
  (yellow). In each case the relative standard deviation of the signal input was set at
  . Initial levels set to correspond to the deterministic steady state associated with the mean values.
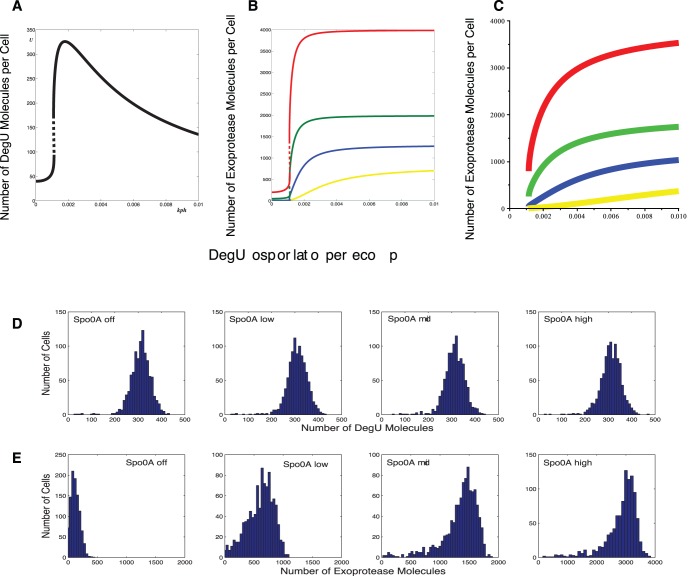
 as computed from equation (S8) in the minimal system. Colours represent: Spo0A High (SinR = 0 and AbrB = 0) (red); Spo0A Mid (SinR = 7 and AbrB = 7) (green); Spo0A Low (SinR = 14 and AbrB = 70) (blue) and Spo0A Off (SinR = 21 and AbrB = 700) (yellow). (D) and (E) shows output from system (1)–(6) computed using the Gillespie SSA. Histograms show the levels of (D) DegU and (E) exoprotease collated from 1000 simulations of the stochastic model at
  hours. All parameter values from Table 1 except for each simulation,
  was drawn from a normally distributed set of values with mean
  and rsd = 20%. As above, Spo0A Off (AbrB = 700, SinR = 21); Spo0A Low (AbrB = 70, SinR = 14); Spo0A Mid (AbrB = 7, SinR = 7); Spo0A High (AbrB = SinR = 0). Note the change of scale for exoprotease copy number in the last figure in (E). Initial values set to correspond to the deterministic steady state associated with the midpoint value.
Similar articles
-
DegU co-ordinates multicellular behaviour exhibited by Bacillus subtilis.Mol Microbiol. 2007 Jul;65(2):554-68. doi: 10.1111/j.1365-2958.2007.05810.x. Epub 2007 Jun 21. Mol Microbiol. 2007. PMID: 17590234
-
Biophysical modeling reveals the transcriptional regulatory mechanism of Spo0A, the master regulator in starving Bacillus subtilis.mSystems. 2025 May 20;10(5):e0007225. doi: 10.1128/msystems.00072-25. Epub 2025 Apr 29. mSystems. 2025. PMID: 40298394 Free PMC article.
-
A pivotal role for the response regulator DegU in controlling multicellular behaviour.Microbiology (Reading). 2009 Jan;155(Pt 1):1-8. doi: 10.1099/mic.0.023903-0. Microbiology (Reading). 2009. PMID: 19118340 Review.
-
The prevalence and origin of exoprotease-producing cells in the Bacillus subtilis biofilm.Microbiology (Reading). 2014 Jan;160(Pt 1):56-66. doi: 10.1099/mic.0.072389-0. Epub 2013 Oct 22. Microbiology (Reading). 2014. PMID: 24149708 Free PMC article.
-
Generation of multiple cell types in Bacillus subtilis.FEMS Microbiol Rev. 2009 Jan;33(1):152-63. doi: 10.1111/j.1574-6976.2008.00148.x. Epub 2008 Nov 19. FEMS Microbiol Rev. 2009. PMID: 19054118 Review.
Cited by
-
CRISPRi screen for enhancing heterologous α-amylase yield in Bacillus subtilis.J Ind Microbiol Biotechnol. 2023 Feb 17;50(1):kuac028. doi: 10.1093/jimb/kuac028. J Ind Microbiol Biotechnol. 2023. PMID: 36564025 Free PMC article.
-
Degradation of extracytoplasmic catalysts for protein folding in Bacillus subtilis.Appl Environ Microbiol. 2014 Feb;80(4):1463-8. doi: 10.1128/AEM.02799-13. Epub 2013 Dec 20. Appl Environ Microbiol. 2014. PMID: 24362423 Free PMC article.
-
Whole-genome sequencing and assessment of a novel protein- and gossypol-degrading Bacillus subtilis strain isolated from intestinal digesta of Tibetan Pigs.BMC Microbiol. 2024 Oct 22;24(1):424. doi: 10.1186/s12866-024-03588-8. BMC Microbiol. 2024. PMID: 39438803 Free PMC article.
-
Synthetic biology outside the cell: linking computational tools to cell-free systems.Front Bioeng Biotechnol. 2014 Dec 9;2:66. doi: 10.3389/fbioe.2014.00066. eCollection 2014. Front Bioeng Biotechnol. 2014. PMID: 25538941 Free PMC article. Review.
-
Phosphorylated DegU manipulates cell fate differentiation in the Bacillus subtilis biofilm.J Bacteriol. 2014 Jan;196(1):16-27. doi: 10.1128/JB.00930-13. Epub 2013 Oct 11. J Bacteriol. 2014. PMID: 24123822 Free PMC article.
References
-
- Shapiro J. Thinking about bacterial populations as multicellular organisms. Annu Rev Microbiol. 1998;52:81–104. - PubMed
-
- Shapiro L, Kaiser D, Losick R. Development and behavior in bacteria. Cell. 1993;73:835–836. - PubMed
-
- Veening J, Smits WK, Kuipers OP. Bistability, epigenetics, and bet-hedging in bacteria. Annu Rev Microbiol. 2008;62:193–210. - PubMed
-
- Bigger W. Treatment of Staphylococcal infections with penicillin by intermittent sterilization. Lancet. 1944;2:497–500.
Publication types
MeSH terms
Substances
Grants and funding
LinkOut - more resources
Full Text Sources
Molecular Biology Databases
Miscellaneous
