. 2012;7(6):e39453.
doi: 10.1371/journal.pone.0039453. Epub 2012 Jun 22.

Anthropogenic habitat disturbance and ecological divergence between incipient species of the malaria mosquito Anopheles gambiae

Affiliations

Anthropogenic habitat disturbance and ecological divergence between incipient species of the malaria mosquito Anopheles gambiae

Colince Kamdem et al. PLoS One. 2012.

Abstract

Background: Anthropogenic habitat disturbance is a prime cause in the current trend of the Earth's reduction in biodiversity. Here we show that the human footprint on the Central African rainforest, which is resulting in deforestation and growth of densely populated urban agglomerates, is associated to ecological divergence and cryptic speciation leading to adaptive radiation within the major malaria mosquito Anopheles gambiae.

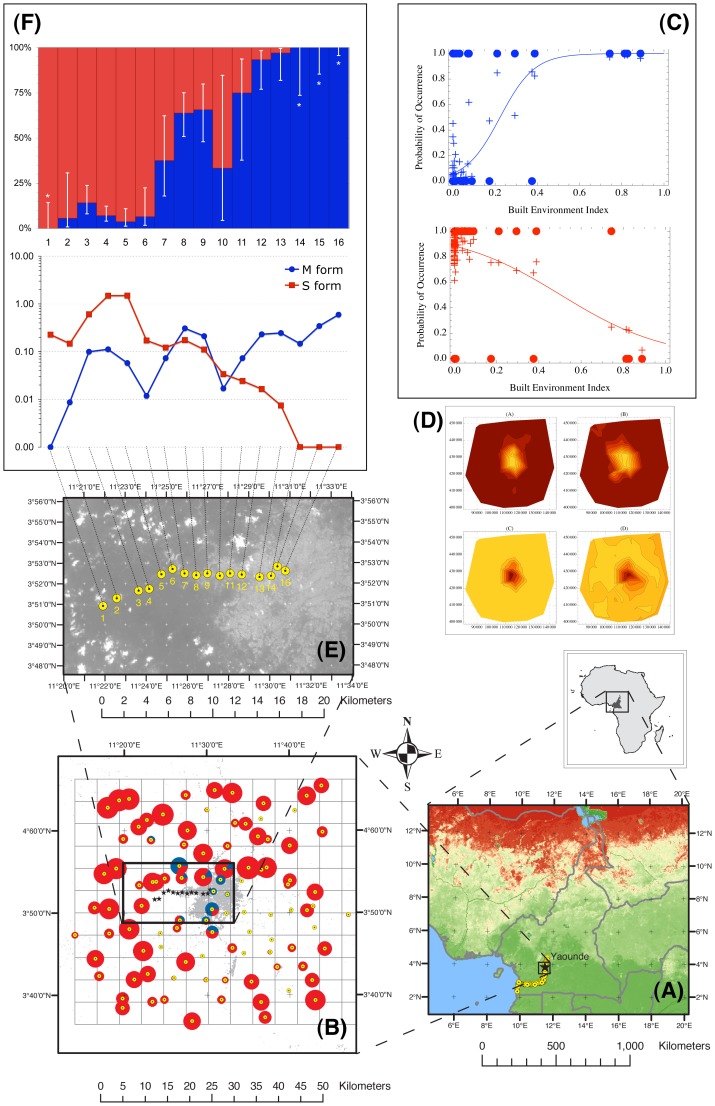
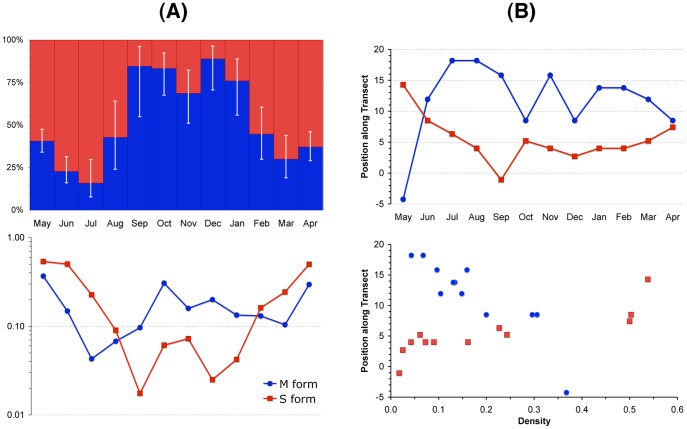
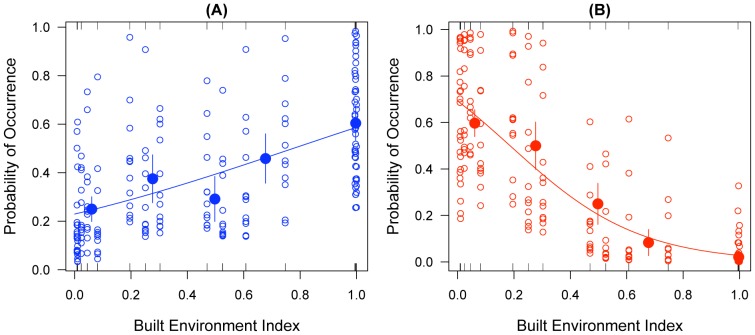
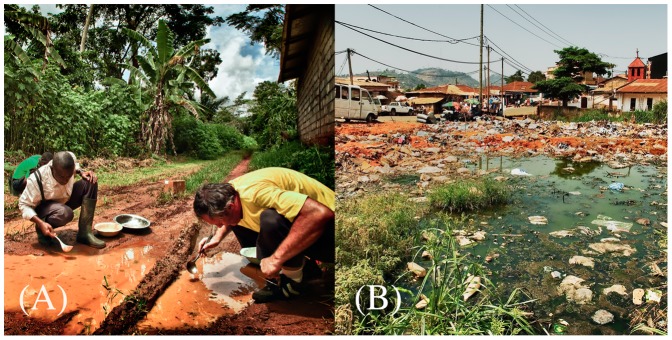
Methodology/principal findings: In southern Cameroon, the frequency of two molecular forms--M and S--among which reproductive isolation is strong but still incomplete, was correlated to an index of urbanisation extracted from remotely sensed data, expressed as the proportion of built-up surface in each sampling unit. The two forms markedly segregated along an urbanisation gradient forming a bimodal cline of ∼6-km width: the S form was exclusive to the rural habitat, whereas only the M form was present in the core of densely urbanised settings, co-occurring at times in the same polluted larval habitats of the southern house mosquito Culex quinquefasciatus--a species association that was not historically recorded before.

Conclusions/significance: Our results indicate that when humans create novel habitats and ecological heterogeneities, they can provide evolutionary opportunities for rapid adaptive niche shifts associated with lineage divergence, whose consequences upon malaria transmission might be significant.


Conflict of interest statement

Competing Interests: The authors have declared that no competing interests exist.

Figures

Figure 1
Figure 1. Distribution and abundance of the molecular forms of Anopheles gambiae in the rainforest of Cameroon, investigated at different geographical scales.
(A) location of the meso-geographic survey area (square), and the sampled sites (dots) serving as the evaluation data set for model validation; dark green individuates the highest values of percentage tree cover outlining the limits of the forest domain (source: Global Land Cover Facility www.landcover.org); (B) relative abundance of M (blue) and S (red) in the meso-geographic survey area. The built environment land class extracted from satellite images is depicted as grey pixels. Dots are sampled localities; those without associated pies returned no An. gambiae. The size of the pies is proportional to the total number of An. gambiae specimens that were collected in each location. The insert shows the localities (stars) and limits of the micro-geographic survey; (C) binary logistic models fitted to the M (blue) and S (red) occurrence data of Figure 1B, in relation to the proportion of surface occupied by the built environment land class. Crosses denote fitted probabilities of an autologistic model taking into account spatial autocorrelation in occurrence; (D) contour plots showing the distribution of interpolated probabilities of occurrence of M (above) and S (below) in the survey area of Fig. 1B. Bright yellow corresponds to highest, and dark red to lowest probability of occurrence. Plots on the left refer to the ordinary logistic (continuous lines in Fig. 1C), those on the right to the autologistic (crosses in Fig. 1C) models; (E) location of 16 sampled localities along a rural to urban transect, superimposed on a SPOT-5 satellite image; (F) relative proportion (±95% confidence limits) and relative density, expressed as mean number of mosquitoes per sampled house, of adult M (blue) and S (red) along the micro-geographic rural to urban transect.
Figure 2
Figure 2. Temporal distribution and abundance of the molecular forms of the malaria mosquito Anopheles gambiae in the rainforest of Cameroon, investigated across one year.
(A) Relative abundance of M (blue) and S (red) by month of collection, starting on May, 2008. The relative proportion (±95% confidence limits) is shown above, the relative density, expressed as mean number of mosquitoes per sampled house, is shown below; (B) position along the rural to urban transect (in arbitrary units corresponding to the identification codes of locations in Fig. 1E) of the median probability of occurrence of M (blue) and S (red) by month of collection (above), and mean An. gambiae density (below).
Figure 3
Figure 3. Binary logistic regression models showing the estimated probability of occurrence of (A) adults of the M form (blue open dots, closed circles and continuous line); and (B) adults of the S form (red open dots, closed circles and continuous line) in relation to the Built Environment Index (BEI) calculated for 1×1 km quadrats including the 16 sites of the micro-geographic rural to urban transect of Fig. 1E.
Tick marks on the floor and ceiling of each scattergram visualise occurrences (0 = absence, 1 = presence); larger thickness of the tick marks denotes higher frequency. Open dots represent the estimated probability of occurrence of the minimal adequate models including the BEI, Anopheles gambiae population density, and sampling effort as explanatory variables. The regression lines visualise the fitted probability of occurrence when only the BEI is included as explanatory variable. Closed circles show the mean observed response of occurrence (± standard errors) for five equally spaced classes of the BEI for visual assessment of ‘goodness-of-fit’.
Figure 4
Figure 4. Larval habitats of the malaria mosquito Anopheles gambiae in the rainforest of Cameroon.
(A) field entomologists ‘dipping’ larvae from the typical rural rain-dependent puddles and ruts where the S form breeds. (B) water collection in an urban dumping ground where the M form breeds. The two sites in the picture are situated respectively in location No. 1 and No. 14 of Fig. 1E. The subjects appearing in panel (A) are among the authors of the paper (BTF and PB) and have given written informed consent (as outlined in the PLoS consent form) to publication of their image.
Figure 5
Figure 5. Species association analysis.
Hurlbert coefficient of species association C8, calculated from presence/absence of Anopheles gambiae and Culex spp. (mostly Cx quinquefasciatus) in urban larval habitats, plotted against an index of aridity calculated on a per-month basis. Lower values of the index indicate greater aridity. The size of the points in the plot is proportional to sample size (i.e. number n of sampled breeding sites; smallest point: n = 76; largest point: n = 173). The colour of the points indicates the town where the samples were collected (black = Douala, grey = Yaounde). Values of C8 significantly greater than statistical independence of occurrence (C8 = 0) are marked with asterisks. *P<0.05; **P<0.01; ***P<0.001.

References

    1. Schluter D. Ecology and the origin of species. TREE. 2001;16:372–380. - PubMed
    1. Vitousek PM. Human domination of Earth’s ecosystems. Science. 1997;277:494–499.
    1. Palumbi SR. Humans as the world’s greatest evolutionary force. Science. 2001;293:1786–1790. - PubMed
    1. Smith TB, Bernatchez L. Evolutionary change in human-altered environments. Molecular Ecology. 2008;17:1–8. - PubMed
    1. Hendry AP, Farrugia TJ, Kinnison MT. Human influences on rates of phenotypic change in wild animal populations. Molecular Ecology. 2008;17:20–29. - PubMed

Publication types