. 2012;7(6):e39559.
doi: 10.1371/journal.pone.0039559. Epub 2012 Jun 20.

Responses of tectal neurons to contrasting stimuli: an electrophysiological study in the barn owl

Affiliations

Responses of tectal neurons to contrasting stimuli: an electrophysiological study in the barn owl

Yael Zahar et al. PLoS One. 2012.

Abstract

The saliency of visual objects is based on the center to background contrast. Particularly objects differing in one feature from the background may be perceived as more salient. It is not clear to what extent this so called "pop-out" effect observed in humans and primates governs saliency perception in non-primates as well. In this study we searched for neural-correlates of pop-out perception in neurons located in the optic tectum of the barn owl. We measured the responses of tectal neurons to stimuli appearing within the visual receptive field, embedded in a large array of additional stimuli (the background). Responses were compared between contrasting and uniform conditions. In a contrasting condition the center was different from the background while in the uniform condition it was identical to the background. Most tectal neurons responded better to stimuli in the contrsating condition compared to the uniform condition when the contrast between center and background was the direction of motion but not when it was the orientation of a bar. Tectal neurons also preferred contrasting over uniform stimuli when the center was looming and the background receding but not when the center was receding and the background looming. Therefore, our results do not support the hypothesis that tectal neurons are sensitive to pop-out per-se. The specific sensitivity to the motion contrasting stimulus is consistent with the idea that object motion and not large field motion (e.g., self-induced motion) is coded in the neural responses of tectal neurons.


Conflict of interest statement

Competing Interests: The authors have declared that no competing interests exist.

Figures

Figure 1
Figure 1. The process of positioning the center stimulus and background elements in the visual display.
A) The neural response of a single recording site in the OT to a vertical bar as a function of the horizontal position of the bar. The red curve is the Gaussian fit to the data points. B) The neural response of the same recording site to the vertical position of the bar. Format as in A. C) Graph showing a typical display on the screen. The x-axis is the horizontal position (in degrees) and the y-axis is the vertical position (in degrees) relative to the visual axis. The red ellipse designates the visual receptive field of the site shown in A and B. The center bar (inside the RF) is shown together with the background bars.
Figure 2
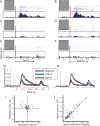
Figure 2. Summary of results from the orientation test.
A–F) The responses of a single site to the orientation test. A) The raster plot shows responses to 15 repetitions of a single bar, oriented −45°, inside the RF (singleton condition) the inset demonstrates the visual stimulus. The corresponding PSTH is shown below the raster plot. The red vertical line designates the onset of stimulation, i.e., the appearance of the bar. B) Responses to 15 repetitions of a single bar inside the RF, oriented +45° (singleton condition). Format as in A. C) Responses to 15 repetitions of the center bar together with the background bars, all oriented −45°(uniform condition). Format as in A. D) Responses to 15 repetitions of the center bar together with the background bars, all oriented +45° (uniform condition). Format as in A. E) Responses to 15 repetitions of the center bar together with the background bars. The center is oriented −45° and the background bars +45° (contrasting condition). Format as in A. F) Responses to 15 repetitions of the center bar together with the background bars. The center is oriented +45° and the background bars −45° (contrasting condition). Format as in A. G) The PSTH curve of the population response to the singleton +45° (blue curve) is compared with the PSTH curve of the population response to the uniform +45° (green curve) and with the PSTH curve of the population response to the contrasting +45° (red curve). The width of the curves designate the SEM. H) The PSTH curve of the population response to the singleton −45° (blue curve) is compared with the PSTH curve of the population response to the uniform −45° (green curve) and with the PSTH curve of the population response to the contrasting −45° (red curve). The width of the curves designate the SEM. I) The scatterplot shows the modulation indices for the −45° center stimulus versus the +45° center stimulus. Each dot represents results from a single recording site. J) The neural responses to the −45° stimuli are shown versus the responses to the +45° stimuli. Each dot represents results from a single recording site. Blue symbols show results from the singleton conditions, red from the contrasting conditions and green from the uniform conditions. The diagonal line displays the locus of equal responses.
Figure 3
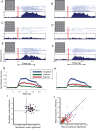
Figure 3. Summary of results from the motion test.
A–F) The responses of a single site to the motion test. A) The raster plot shows responses to 15 repetitions of a bar inside the RF moving rightwards while the background bars are static (singleton condition). The inset demonstrates the visual stimulus. The arrow in the inset points to the direction of movement. The corresponding PSTH is shown below the raster plot. The red vertical line designates the onset of stimulation, i.e., the initiation of movement. B) Responses to 15 repetitions of a bar inside the RF moving leftwards while the background bars are static (singleton condition). Format as in A. C) Responses to 15 repetitions of the center bar moving rightwards together with all the background bars (uniform condition). Format as in A. D) Responses to 15 repetitions of the center bar moving leftwards together with all the background bars (uniform condition). Format as in A. E) Responses to 15 repetitions of the center bar moving rightwards together with background bars that are moving leftwards (contrasting condition). Format as in A. F) Responses to 15 repetitions of the center bar moving leftwards together with background bars that are moving rightwards (contrasting condition). Format as in A. G) The PSTH curve of the population response to the singleton rightwards movement (blue curve) is compared with the PSTH curve of the population response to the uniform rightwards movement (green curve) and with the PSTH curve of the population response to the contrasting rightwards movement (red curve). The width of the curves designate the SEM H) The PSTH curve of the population response to the singleton leftwards movement (blue curve) is compared with the PSTH curve of the population response to the uniform leftwards movement (green curve) and with the PSTH curve of the population response to the contrasting leftwards movement (red curve). The width of the curves designate the SEM. I) The scatterplot shows the modulation indices for the leftwards moving center stimulus versus the rightwards moving center stimulus. Each dot represents results from a single recording site. J) The neural responses to the leftwards moving center stimulus are shown versus the responses to the rightwards moving center stimulus. Each dot represents results from a single recording site. Blue symbols show results from the singleton conditions, red from the contrasting conditions and green from the uniform conditions. The diagonal line displays the locus of equal responses.
Figure 4
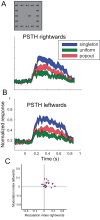
Figure 4. Responses to the motion test with large separation between center and background elements.
A) The inset illustrates the test conditions where the stimulus at the center of the display is separated from the background elements by a gap of 20°. The PSTH curve of the population response to the singleton rightwards movement (blue curve) is compared with the PSTH curve of the population response to the uniform rightwards movement (green curve) and with the PSTH curve of the population response to the contrasting rightwards movement (red curve). The width of the curves designate the SEM. B) The PSTH curve of the population response to the singleton leftwards movement (blue curve) is compared with the PSTH curve of the population response to the uniform leftwards movement (green curve) and with the PSTH curve of the population response to the contrasting leftwards movement (red curve). The width of the curves designate the SEM. C) The scatterplot shows the modulation indices for the leftwards moving stimuli versus the rightwards moving stimuli. Each dot represents results from a single recording site.
Figure 5
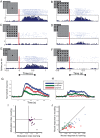
Figure 5. Summary of results from the looming test.
A–F) The responses of a single site to the looming/receding test. A) The raster plot shows responses to 15 repetitions of a looming dot inside the RF while the background dots are static (singleton condition). The inset demonstrates the visual stimulus. The hind frame illustrates the initial picture, at the onset of stimulation, and the front frame illustrates the final picture. The corresponding PSTH is shown below the raster plot. The red vertical line designates the onset of stimulation, i.e., the initiation of movement. B) Responses to 15 repetitions of a receding dot in the RF while the background dots are static (singleton condition). Format as in A. C) Responses to 15 repetitions of all dots looming together (uniform condition). Format as in A. D) Responses to 15 repetitions of all dots receding together (uniform condition). Format as in A. E) Responses to 15 repetitions of the center dot looming together with the background dots receding (contrasting condition). Format as in A. F) Responses to 15 repetitions of the center dot receding together with the background dots looming (contrasting condition). Format as in A. G) The PSTH curve of the population response to the singleton looming (blue curve) is compared with the PSTH curve of the population response to the uniform looming (green curve) and with the PSTH curve of the population response to the contrasting looming (red curve). The width of the curves designate the SEM. H) The PSTH curve of the population response to the singleton receding (blue curve) is compared with the PSTH curve of the population response to the uniform receding (green curve) and with the PSTH curve of the population response to the contrasting receding (red curve). The width of the curves designate the SEM. I) The scatterplot shows the modulation indices for the receding center stimulus versus the looming center stimulus. Each dot represents results from a single recording site. J) The neural responses to the receding stimuli are shown versus the responses to the looming stimuli. Each dot represents results from a single site. Blue symbols show results from the singleton conditions, red from the contrasting conditions and green symbols results from the uniform conditions. The diagonal line displays the locus of equal responses.

Similar articles

Cited by

References

    1. Treisman A. Perceptual grouping and attention in visual search for features and for objects. J Exp Psychol Hum Percept Perform. 1982;8:194–214. - PubMed
    1. Hochstein S, Ahissar M. View from the top: hierarchies and reverse hierarchies in the visual system. Neuron. 2002;36:791–804. - PubMed
    1. Blough DS. Visual search in the pigeon: hunt and peck method. Science. 1977;196:1013–1014. - PubMed
    1. Posner MI, Cohen Y editors. Components of visual orienting. Hilsdale, New Jersey: Erlbaum. 1984.
    1. Harmening WM, Orlowski J, Ben-Shahar O, Wagner H. Overt attention toward oriented objects in free-viewing barn owls. Proc Natl Acad Sci U S A. 2011;108:8461–8466. - PMC - PubMed

Publication types