. 2012:2012:312503.
doi: 10.1155/2012/312503. Epub 2012 Apr 29.

Overall Memory Impairment Identification with Mathematical Modeling of the CVLT-II Learning Curve in Multiple Sclerosis

Affiliations

Overall Memory Impairment Identification with Mathematical Modeling of the CVLT-II Learning Curve in Multiple Sclerosis

Igor I Stepanov et al. Mult Scler Int. 2012.

Abstract

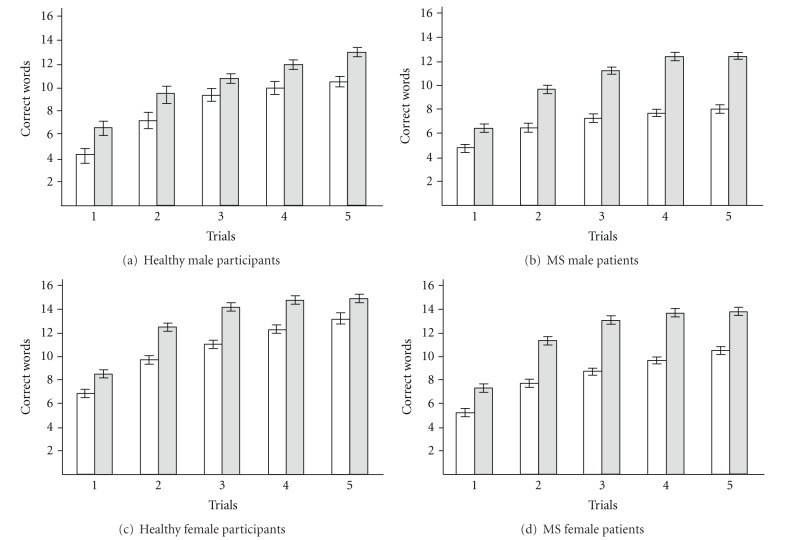
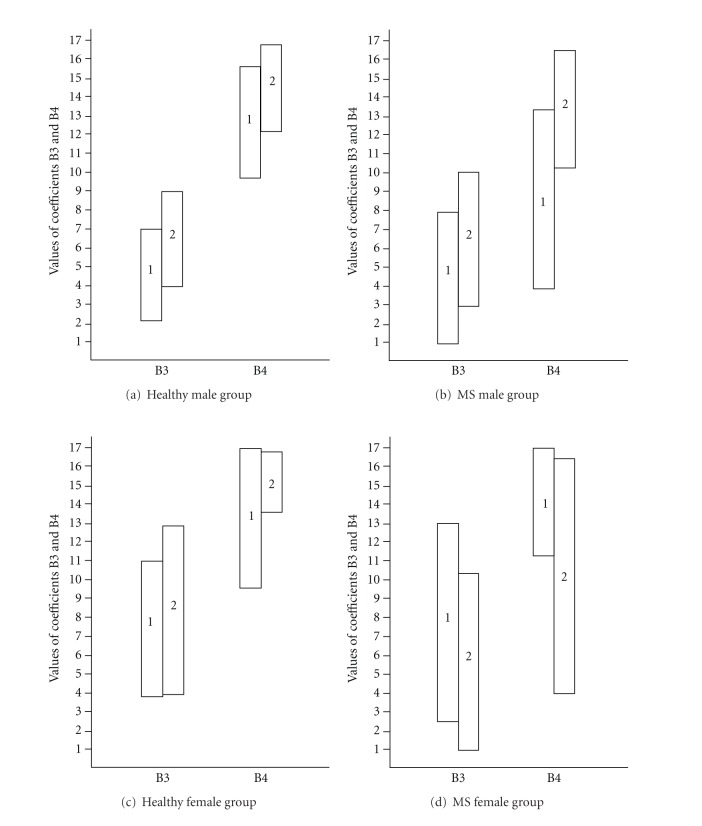
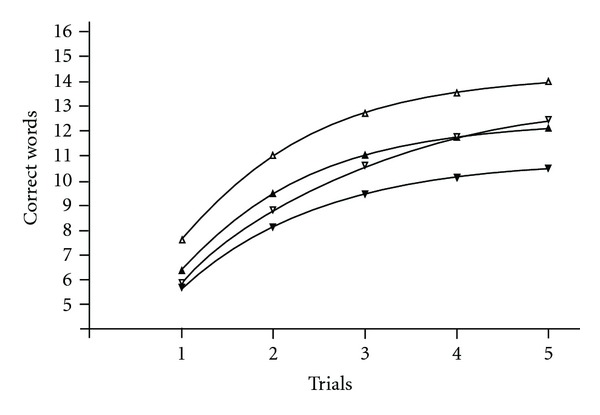
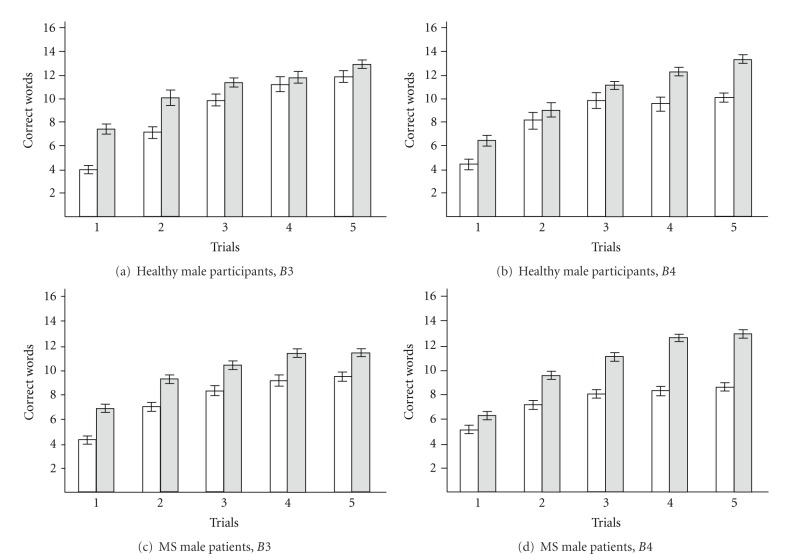
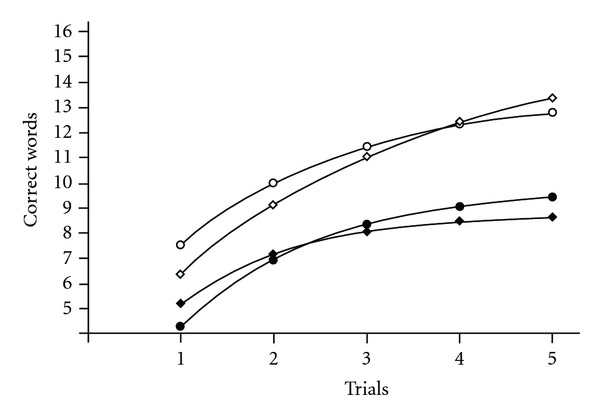
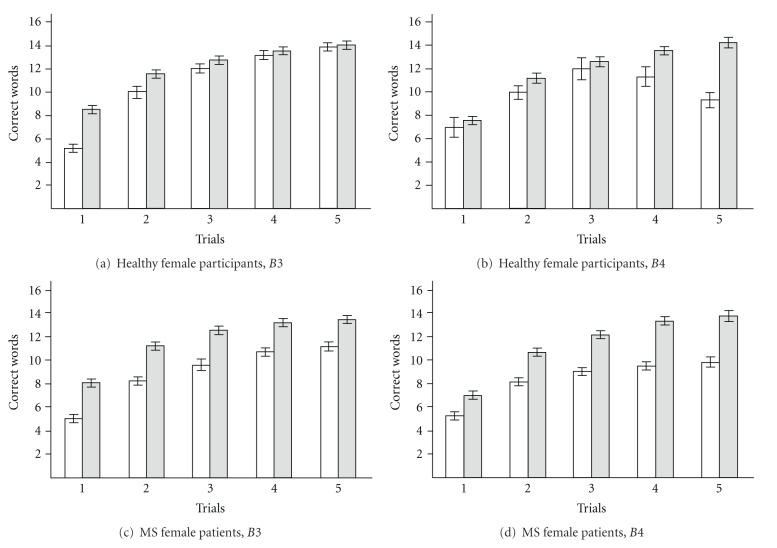
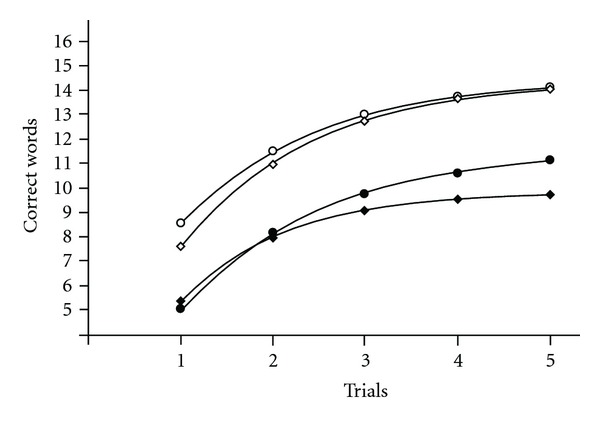
The CVLT-II provides standardized scores for each of the List A five learning trials, so that the clinician can compare the patient's raw trials 1-5 scores with standardized ones. However, frequently, a patient's raw scores fluctuate making a proper interpretation difficult. The CVLT-II does not offer any other methods for classifying a patient's learning and memory status on the background of the learning curve. The main objective of this research is to illustrate that discriminant analysis provides an accurate assessment of the learning curve, if suitable predictor variables are selected. Normal controls were ninety-eight healthy volunteers (78 females and 20 males). A group of MS patients included 365 patients (266 females and 99 males) with clinically defined multiple sclerosis. We show that the best predictor variables are coefficients B3 and B4 of our mathematical model B3 ∗ exp(-B2 ∗ (X - 1)) + B4 ∗ (1 - exp(-B2 ∗ (X - 1))) because discriminant functions, calculated separately for B3 and B4, allow nearly 100% correct classification. These predictors allow identification of separate impairment of readiness to learn or ability to learn, or both.


Figures

Figure 1
Figure 1
Cluster analysis of the CVLT-II measures trials 1–5. (a) Healthy male participants, cluster referring to lower memory functioning (9 cases) and cluster referring to higher memory functioning (11 cases). Comparing the values for every trial with a t-test for independent samples revealed that the same trial values differed between cluster referring to lower memory functioning and cluster referring to higher memory functioning (P < .05) with the exception of Trial 3 (P = .075). (b) MS male patients, cluster referring to lower memory functioning (46 cases) and cluster referring to higher memory functioning (53 cases). Comparing the values for each of the five trials with a t-test for independent samples, revealed significant differences between cluster referring to lower memory functioning and cluster referring to higher memory functioning for each trial (P ≤ .001). (c) Healthy female participants, cluster referring to lower memory functioning (38 participants) and cluster referring to higher memory functioning (40 participants). Comparing values for every trial with a t-test for independent samples revealed that the same trial values differed between cluster referring to lower memory functioning and cluster referring to higher memory functioning (P < .001). (d) MS female patients, cluster referring to lower memory functioning (133 patients) and cluster referring to higher memory functioning (133 patients). Comparing values for every trial with a t-test for independent samples revealed that the same trial values differed between cluster referring to lower memory functioning and cluster referring to higher memory functioning (P < .001). Cluster referring to lower memory functioning—white bar, cluster referring to higher memory functioning—gray bar. Each bar represents mean ± S.E.M.
Figure 2
Figure 2
Overlapping of B3 or B4 values between clusters after clustering CVLT-II measures trials 1–5. (a) Healthy male group; (b) MS male group; (c) Healthy female group; (d) MS female group. 1 is the range of the cluster referring to lower memory functioning; 2 is the range of the cluster referring to higher memory functioning. Identification of coefficients is given on the abscissa. This figure illustrates that clustering of raw recall scores does not allow distinguishing between B3 and B4 due to considerable overlapping of each coefficient's values between cluster referring to lower memory functioning and cluster referring to higher memory functioning from healthy participants and MS patients.
Figure 3
Figure 3
The averaged learning curves over all healthy participants and MS patients. Empty triangles—Healthy female participants; B2 = 0.70; B3 = 7.63; B4 = 14.38. Filled triangles—MS female patients; B2 = 0.72; B3 = 6.35; B4 = 12.44. Empty down triangles—Healthy male participants; B2 = 0.47; B3 = 5.90; B4 = 13.58. Filled down triangles—MS male patients; B2 = 0.64; B3 = 5.66; B4 = 10.86. B3 is higher in healthy females versus healthy males (P = .0016). B3 (P = .0019) and B4 (P = .0018) is higher in healthy female participants versus MS female patients. B4 is higher in healthy male participants versus MS male participants (P = .006). B3 (P = .006) and B4 (P = .002) is higher in MS female patients in comparison with MS male patients.
Figure 4
Figure 4
Cluster analysis using B3 or B4 in males. (a) Healthy male participants: clustering using B3 only, cluster referring to lower memory functioning (9 cases) and cluster referring to higher memory functioning (11 cases). There is no overlap between these B3 clusters. (b) Healthy male participants: clustering using B4 only, cluster referring to lower memory functioning (5 cases) and cluster referring to higher memory functioning (15 cases). There is no overlap between these B4 clusters. (c) MS male patients: clustering using B3 only, cluster referring to lower memory functioning (48 cases) and cluster referring to higher memory functioning (51 cases). There is no overlap between these B3 clusters. (d) MS male patients: clustering using B4 only, cluster referring to lower memory functioning (59 cases) and cluster referring to higher memory functioning (40 cases). There is no overlap between these B4 clusters. Cluster referring to lower memory functioning—white bars, cluster referring to higher memory functioning—gray bars. Each bar represents mean ± S.E.M.
Figure 5
Figure 5
The averaged learning curves over cluster referring to lower memory functioning and cluster referring to higher memory functioning for healthy male participants and MS male patients, using B3 or B4. Empty circles—cluster referring to higher memory functioning using B3 in healthy male participants; B2 = 0.53; B3 = 7.50; B4 = 13.46. Empty diamonds—cluster referring to higher memory functioning using B4 in healthy male participants; B2 = 0.34; B3 = 6.39; B4 = 15.76. Filled circles—cluster referring to lower memory functioning using B3 in MS male patients; B2 = 0.65; B3 = 4.26; B4 = 9.81. Filled diamonds—cluster referring to lower memory functioning using B4 in MS male patients; B2 = 0.82; B3 = 5.17; B4 = 8.74. In healthy male participants, B3 is higher in cluster referring to higher memory functioning using B3 (P = .04) in comparison with cluster referring to higher memory functioning using B4. In MS patients, B3 was higher in cluster referring to lower memory functioning using B4 (P = .0002). However, B4 was higher in cluster referring to lower memory functioning using B3 (P = .0008).
Figure 6
Figure 6
Cluster analysis using B3 or B4 in females. (a) Healthy female participants: clustering using B3 only, cluster referring to lower memory functioning (22 cases) and cluster referring to higher memory functioning (56 cases). There is no overlap between these B3 clusters. (b) Healthy female participants: clustering using B4 only, cluster referring to lower memory functioning (3 cases) and cluster referring to higher memory functioning (75 cases). There is no overlap between these B4 clusters. (c) MS female patients: clustering using B3 only, cluster referring to lower memory functioning (152 cases) and cluster referring to higher memory functioning (114 cases). There is no overlap between these B3 clusters. (d) MS female patients: clustering using B4 only, cluster referring to lower memory functioning (109 cases) and cluster referring to higher memory functioning (157 cases). There is no overlap between these B4 clusters. Cluster referring to lower memory functioning—white bars, cluster referring to higher memory functioning—gray bars. Each bar represents mean ± S.E.M.
Figure 7
Figure 7
The averaged learning curves over cluster referring to lower memory functioning and cluster referring to higher memory functioning for healthy female participants and MS female patients, using B3 or B4. Empty circles—cluster referring to higher memory functioning using B3 in healthy female participants; B2 = 0.69; B3 = 8.56; B4 = 14.43. Empty diamonds—cluster referring to higher memory functioning using B4 in healthy female participants; B2 = 0.66; B3 = 7.67; B4 = 14.63. Filled circles—cluster referring to lower memory functioning using B3 in MS female patients; B2 = 0.63; B3 = 5.06; B4 = 11.62. Filled diamonds—cluster referring to lower memory functioning using B4 in MS female patients; B2 = 0.86; B3 = 5.41; B4 = 9.88. In healthy female participants B3 is higher in cluster referring to higher memory functioning using B3 (P = .019) in comparison with cluster referring to higher memory functioning using B4. In MS patients B4 (P = .003) is higher in the cluster referring to lower memory functioning using B3 versus cluster referring to lower memory functioning using B4. B3 (P = .00005) and B4 (P = .0008) differs highly significant between cluster referring to higher memory functioning for healthy females and cluster referring to lower memory functioning for MS females using B3. Besides B3 (P = .0006) and B4 (P = .0002) differs highly significant between cluster referring to higher memory functioning for healthy females and cluster referring to lower memory functioning for MS females using B4.

Similar articles

Cited by

  • Learning in Plants: Lessons from Mimosa pudica.
    Abramson CI, Chicas-Mosier AM. Abramson CI, et al. Front Psychol. 2016 Mar 31;7:417. doi: 10.3389/fpsyg.2016.00417. eCollection 2016. Front Psychol. 2016. PMID: 27065905 Free PMC article. Review.

References

    1. Compston A, Coles A. Multiple sclerosis. The Lancet. 2008;372(9648):1502–1517. - PubMed
    1. Miller DH, Albert PS, Barkhof F, et al. Guidelines for the use of magnetic resonance techniques in monitoring the treatment of multiple sclerosis. Annals of Neurology. 1996;39(1):6–16. - PubMed
    1. Fisher E, Lee JC, Nakamura K, Rudick RA. Gray matter atrophy in multiple sclerosis: a longitudinal study. Annals of Neurology. 2008;64(3):255–265. - PubMed
    1. Benedict RHB, Cookfair D, Gavett R, et al. Validity of the minimal assessment of cognitive function in multiple sclerosis (MACFIMS) Journal of the International Neuropsychological Society. 2006;12(4):549–558. - PubMed
    1. Heaton RK, Nelson LM, Thompson DS. Neoropsychologicl findings in relapsing—remitting and chronic—progressivd multiple sclerosis. Journal of Consulting and Clinical Psychology. 1985;53(1):103–110. - PubMed

LinkOut - more resources