. 2012 Aug 7;84(15):6438-43.
doi: 10.1021/ac300264v. Epub 2012 Jul 10.

Microfluidics-based assessment of cell deformability

Affiliations

Microfluidics-based assessment of cell deformability

Andrea Adamo et al. Anal Chem. .

Abstract

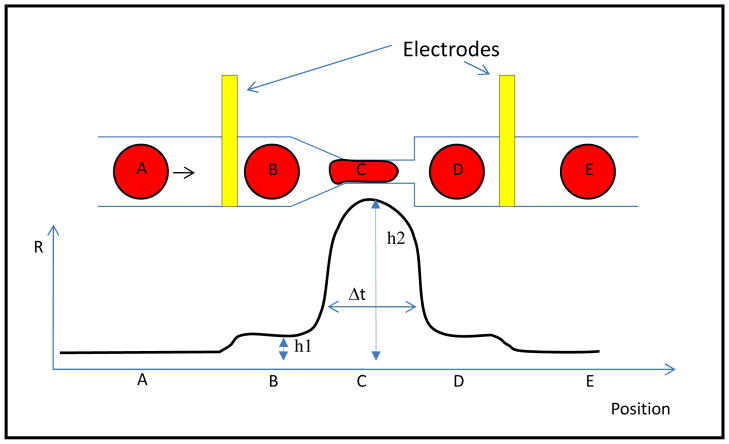
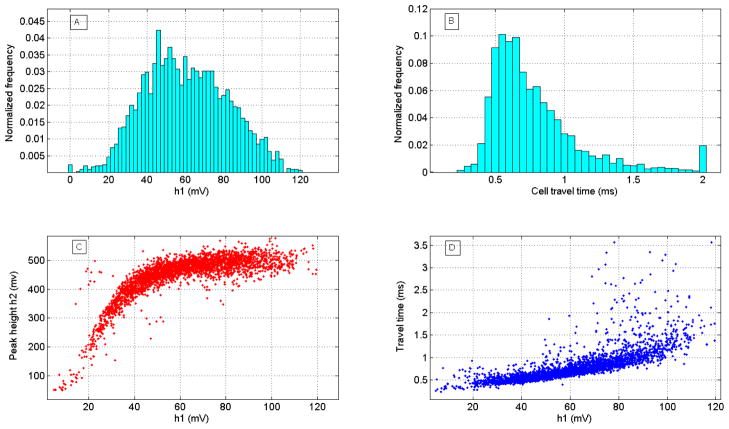
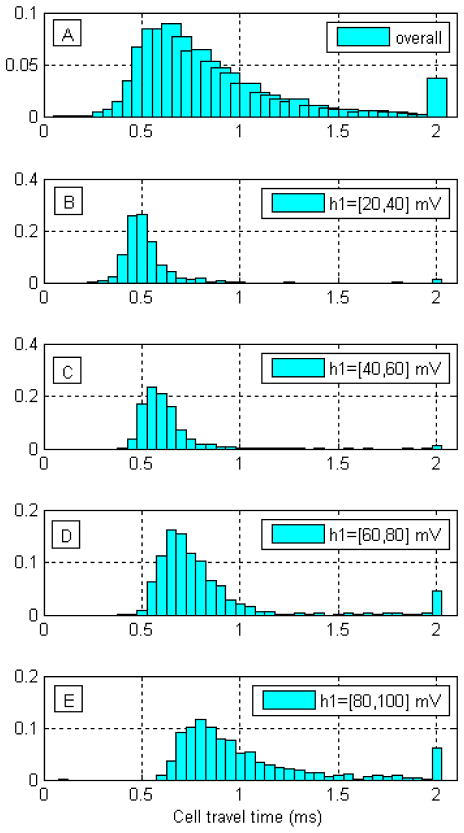
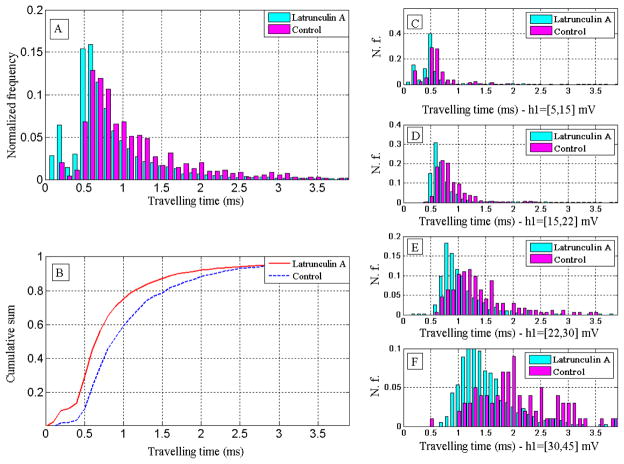
Mechanical properties of cells have been shown to have a significant role in disease, as in many instances cell stiffness changes when a cell is no longer healthy. We present a high-throughput microfluidics-based approach that exploits the connection between travel time of a cell through a narrow passage and cell stiffness. The system resolves both cell travel time and relative cell diameter while retaining information on the cell level. We show that stiffer cells have longer transit times than less stiff ones and that cell size significantly influences travel times. Experiments with untreated HeLa cells and cells made compliant with latrunculin A and cytochalasin B further demonstrate that travel time is influenced by cell stiffness, with the compliant cells having faster transit time.


Figures

Figure 1
Figure 1
Microfluidic concept for measuring cell deformability. Suspended cells travel through a microfluidic channel that presents a funnel shaped constriction. The electrical resistance across two electrodes placed on either side of the constriction is measured upon passage of the cell. This resistance is expected to increase from baseline (position A) to a value “h1” when the cell is in-between the two electrodes, but not yet in the constriction, (position B). The resistance subsequently peaks at a value “h2” when the cell is fully engaged in the constriction (position C) and then returns to the h1 value when the cell is between the narrowing and the downstream electrode (position D). Finally, the resistance goes back to the baseline value once the cell is beyond the downstream electrode (position E). The width of the signal (Δt) measures the time that the cell needs to travel through the constriction.
Figure 2
Figure 2
Microfluidic device and its packaging for measuring cell deformability. Frame A shows the microfluidic device made of silicon and bonded to a borofloat glass. Gold electrodes deposited onto the borofloat glass are apparent. Frame B shows the device packaged with compression parts (Aluminum and HDPE) to provide a cell reservoir and easily accessible electrical connections. Frame C shows a close up view of the channel constriction with the electrodes; flow is from right to left (20X magnification).
Figure 3
Figure 3
Variations in the electrical signal at the passage of a cell. Frames extracted from a high speed movie of a cell passing through the microfluidic chip (movie in supplementary information). Fluid flows from left to right. A cell approaches the upstream electrode (frame a), it passes between the upstream electrode and the funnel shaped constriction (frame b), it changes shape to go through the narrowing (frame c), it enters the space between the funnel shaped narrowing and the downstream electrode (frame d) and finally it arrives downstream of the downstream electrode (frame e). The white arrow marks the position of the cell. Frame f represents the signal recorded from the electrodes during the passage of the cell. The blue dotted vertical lines on the signal identify the time of acquisition of images a to e. Importantly, the electrical signal varies as expected and shown schematically in Fig. 1. Analysis of the correspondence between the high speed imaging and the recorded electrical signal shows that Δt measures the cell transit time through the channel.
Figure 4
Figure 4
Results of flowing HeLa cells through the device with a driving pressure of 4 psi. a) Histogram of the value of the flat area of the signal h1. h1 appears to have a symmetric bell shaped distribution as expected for a measurement of cell size in cultured cells. The bar at 0 mv represents the fraction of cells for which the software did not succeed to retrieve h1. B) Histogram of cell travel time through the funnel shaped constriction. Travel time has a non-symmetric distribution with a long tail at higher transversal times. The most frequent value (mode) is 0.58 ms. The bar at 2ms represents all the cells with travel time higher than 2 ms. C) Relationship between peak height h2 and value of flat area h1. h2 (maximum resistance observed at the passage of the cell) depends linearly on h1 (cell size) for low values of h1 but saturates around h1=~50mV. D) Relationship between cell travel time Δt and value of h1. The scattering of travel time values increases for values of h1 larger than ~50mV.
Fig. 5
Fig. 5
Cell travel time through the microchannel narrowing depends on cell diameter. A) Histogram of cell transit time measured on ~3000 HeLa cells. Transit time has a non-symmetric, wide distribution. B to E) Histograms of cell travel times for classes of cells with different diameters, as reflected by h1. B) h1 values 20–40 mv. C) h1 values 40–60 mV. D) h1 values 60 to 80 mV. E) h1 values 80–100 mv (largest cells). Cell transit time is significantly influenced by diameter with larger cells showing longer transit times than smaller cells. All cells with travel times > 2ms are pooled in the 2ms bar
Figure 6
Figure 6
Cell travel time through the microchannel narrowing depends on cell deformability. HeLa cells were treated with Latrunculin A (0.1μM for 1h) to interfere with actin polymerization and reduce cell stiffness. A: Histogram of the travel time of treated sample and the control (samples are taken from the same original population and passed through the same device). B: cumulative sums of the travel time histograms for both treated and control sample. The travel time of the treated sample is shorter than the control for any percentile. C–F: histograms of travel time of treated and control sample for different values of cell diameter reflected by ranges of the signal flat area parameter h1 [in brackets]. For each range of cell diameter the treated sample has a shorter travel time than the control, the difference is more prominent for larger diameters.

References

    1. Ingber DE. Ann Med. 2003;35:564. - PubMed
    1. Suresh S, Spatz J, Mills JP, Micoulet A, Dao M, Lim CT, Beil M, Seufferlein T. Acta Biomater. 2005;1:15. - PubMed
    1. Beil M, Micoulet A, von Wichert G, Paschke S, Walther P, Omary MB, Van Veldhoven PP, Gern U, Wolff-Hieber E, Eggermann J, Waltenberger J, Adler G, Spatz J, Seufferlein T. Nat Cell Biol. 2003;5:803. - PubMed
    1. Lekka M, Laidler P, Gil D, Lekki J, Stachura Z, Hrynkiewicz AZ. Eur Biophys J. 1999;28:312. - PubMed
    1. Suresh S. Acta Biomater. 2007;3:413. - PMC - PubMed

Publication types