. 2012 Jul 2:13:300.
doi: 10.1186/1471-2164-13-300.

Single-base resolution maps of cultivated and wild rice methylomes and regulatory roles of DNA methylation in plant gene expression

Affiliations

Single-base resolution maps of cultivated and wild rice methylomes and regulatory roles of DNA methylation in plant gene expression

Xin Li et al. BMC Genomics. .

Abstract

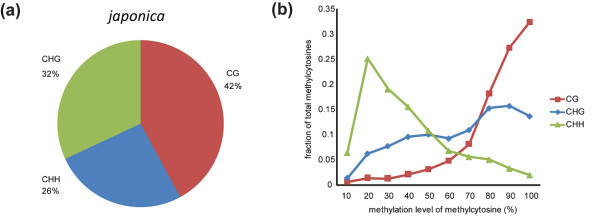
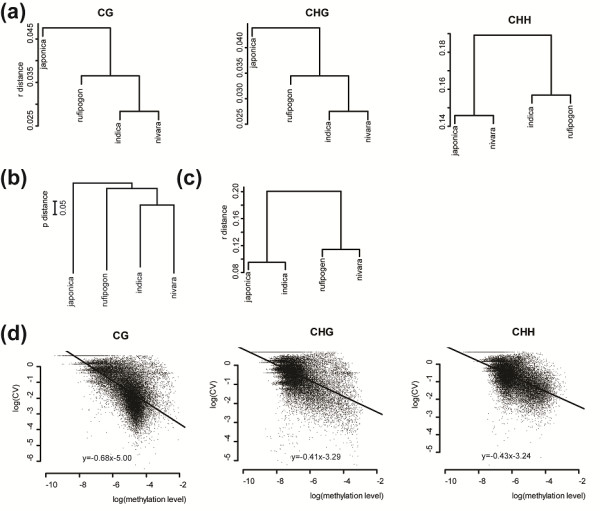
Background: DNA methylation plays important biological roles in plants and animals. To examine the rice genomic methylation landscape and assess its functional significance, we generated single-base resolution DNA methylome maps for Asian cultivated rice Oryza sativa ssp. japonica, indica and their wild relatives, Oryza rufipogon and Oryza nivara.

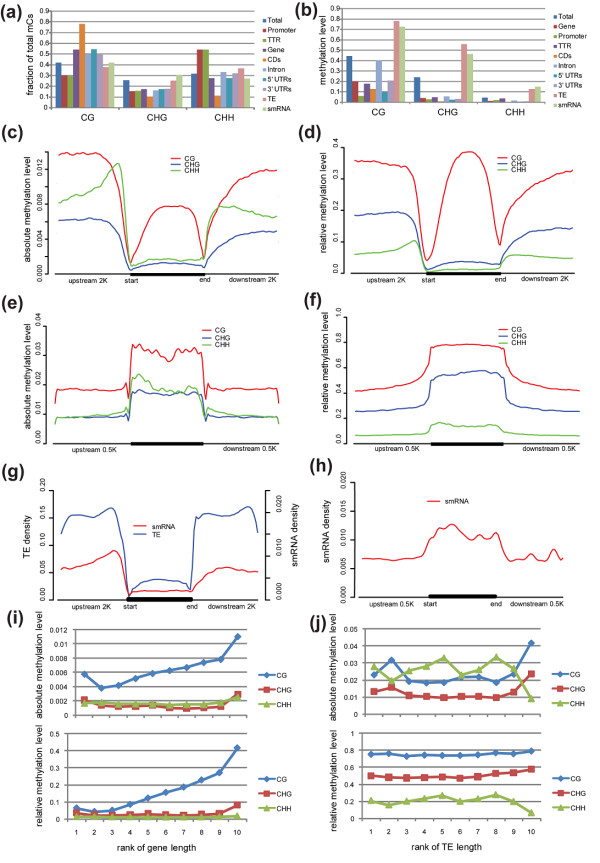
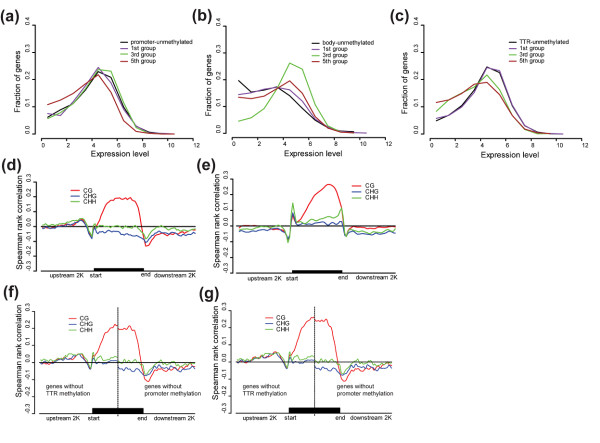
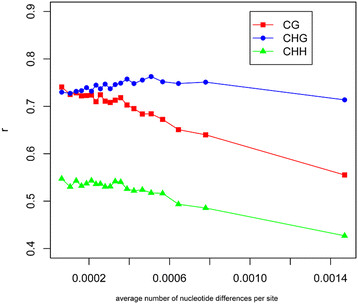
Results: The overall methylation level of rice genomes is four times higher than that of Arabidopsis. Consistent with the results reported for Arabidopsis, methylation in promoters represses gene expression while gene-body methylation generally appears to be positively associated with gene expression. Interestingly, we discovered that methylation in gene transcriptional termination regions (TTRs) can significantly repress gene expression, and the effect is even stronger than that of promoter methylation. Through integrated analysis of genomic, DNA methylomic and transcriptomic differences between cultivated and wild rice, we found that primary DNA sequence divergence is the major determinant of methylational differences at the whole genome level, but DNA methylational difference alone can only account for limited gene expression variation between the cultivated and wild rice. Furthermore, we identified a number of genes with significant difference in methylation level between the wild and cultivated rice.

Conclusions: The single-base resolution methylomes of rice obtained in this study have not only broadened our understanding of the mechanism and function of DNA methylation in plant genomes, but also provided valuable data for future studies of rice epigenetics and the epigenetic differentiation between wild and cultivated rice.


Figures

Figure 1
Figure 1
DNA methylation pattern in the japonica rice (Dianjingyou1). (a) Relative proportions of mCs in three sequence contexts. (b) Distribution of methylation level of mCs in each sequence context. Only mCs covered by at least 5 reads were used to calculate methylation level. Methylation level on the x-axis was defined as the percentage of reads showing methylated cytosine at a reference cytosine site. The y-axis indicates the fraction of total mCs calculated within bins of 10%.
Figure 2
Figure 2
DNA methylation patterns in different genomic regions. Methylation patterns were characterized in following functional regions: TEs, small RNA (smRNA) loci, and genic regions including the promoter (200 bp upstream of the transcriptional start site, TSS), gene body (the entire transcribed region), and the transcriptional termination region (TTR, 200 bp downstream of transcriptional termination site). Gene body is further divided into untranslated regions (UTRs), coding regions (CDs), and introns. Methylation level, TE density and smRNA locus density were calculated across TE, gene body and their flanking sequences using an overlapping sliding window of 5% of the sequence length at a step of 2.5% of the sequence length. (a) Fraction of total mCs in each sequence context for different genomic regions. (b) Relative methylation level (total methylation level of mCs divided by sequence length of the calculated region) in each sequence context for different genomic regions. Distributions of absolute methylation level (total methylation level of mCs divided by total number of cytosine sites in the calculated region) (c) and relative methylation level (d) in gene body and 2-kb flanking sequences on both sides. Absolute (e) and relative (f) methylation level distributions in TE and 0.5-kb flanking sequences on both sides. (g) TE and smRNA density distributions in gene body and 2-kb flanking sequences. (h) smRNA density distribution throughout TE and 0.5 kb-flanking sequences. Relationships between methylation level and sequence length in genes (i) and TE regions (j), in which both absolute (top) and relative (bottom) methylation levels were analyzed.
Figure 3
Figure 3
Distribution of mCs on the sense and antisense strands of rice chromosomes for each sequence context. The sliding window size is 50 kb and the step size is 25 kb. The black circle indicates the centromeric position of a chromosome. Some centromeric regions of chromosomes have not been completely sequenced and thus are displayed as gaps in the figure.
Figure 4
Figure 4
Relationship between methylation level and gene expression in different genic regions. (a) Promoter; (b) Gene body; (c) TTR. Methylation level was measured using the absolute methylation level but similar results were also obtained using the relative methylation level. Genes are categorized into unmethylated (black line) and methylated ones, the latter of which were further divided into five groups based on the absolute methylation level (from Group 1 of the 20% of genes with the lowest methylation level to Group 5 of the 20% with the highest methylation level). For clarity, we only display 1st, 3rd and 5th groups. Methylation-expression Spearman correlation coefficients along genes and their 2 kb-flanking regions in rice (d) and Arabidopsis(e). The methylation-expression Spearman correlation coefficients were also calculated in TTR and promoter regions using genes without TTR methylation (left to the dashed line) and genes without promoter methylation (right to the dashed line) respectively. Methylation was measured using absolute methylation level (f) or relative methylation level (g). The correlation coefficients were calculated using an overlapping sliding window of 5% of sequence length at a step of 2.5% of sequence length.
Figure 5
Figure 5
Cluster analyses based on genome-wide cytosine methylation, SNPs and gene expression profiles of the four rice samples. (a) Methylation tree for each sequence context. (b) Genomic tree based on SNPs. (c) Expression tree. Methylation and expression trees were constructed using the distances of correlation coefficients (r) of whole-genome methylation and expression profiles, respectively, among the samples. (d) Relationship between methylation level and their variation among species. The x-axis indicates the log2 transformed methylation level of each sliding-window, and y-axis indicates the log2 transformed CV of corresponding region among four samples.
Figure 6
Figure 6
Relationship between genetic and methylation divergence in each sequence contexts. The average number of nucleotide differences per site (indicated by x-axis) and average Spearman correlation coefficients (r) of methylation level of all cytosines among samples (indicated by y-axis) were calculated for each 50-kb sliding window with a step of 25 kb across the whole genome. Then all sliding windows were classified into 20 groups with equal numbers (657 sliding windows) according to their π values from the lowest to the highest. The average number of nucleotide differences per site and r of each group were calculated and their values were plotted. Because most sliding windows have relatively small values of average number of nucleotide differences per site, the data points in the figure were enriched in the left.

Similar articles

Cited by

References

    1. Suzuki MM, Bird A. DNA methylation landscapes: provocative insights from epigenomics. Nat Rev Genet. 2008;9:465–476. - PubMed
    1. Richards EJ. Inherited epigenetic variation – revisiting soft inheritance. Nat Rev Genet. 2006;7:395–401. - PubMed
    1. Kalisz S, Purugganan MD. Epialleles via DNA methylation: consequences for plant evolution. Trends in Ecol Evol. 2004;19:309–314. doi: 10.1016/j.tree.2004.03.034. - DOI - PubMed
    1. Manning K, Tor M, Poole M, Hong Y, Thompson AJ, King GJ, Giovannoni JJ, Seymour GB. A naturally occurring epigenetic mutation in a gene encoding an SBP-box transcription factor inhibits tomato fruit ripening. Nat Genet. 2006;38:948–952. doi: 10.1038/ng1841. - DOI - PubMed
    1. Cubas P, Vincent C, Coen E. An epigenetic mutation responsible for natural variation in floral symmetry. Nature. 1999;401:157–161. doi: 10.1038/43657. - DOI - PubMed

Publication types

Associated data