. 2012 Dec;167(7):1448-66.
doi: 10.1111/j.1476-5381.2012.02090.x.

Functional monoclonal antibody acts as a biased agonist by inducing internalization of metabotropic glutamate receptor 7

Affiliations

Functional monoclonal antibody acts as a biased agonist by inducing internalization of metabotropic glutamate receptor 7

C Ullmer et al. Br J Pharmacol. 2012 Dec.

Abstract

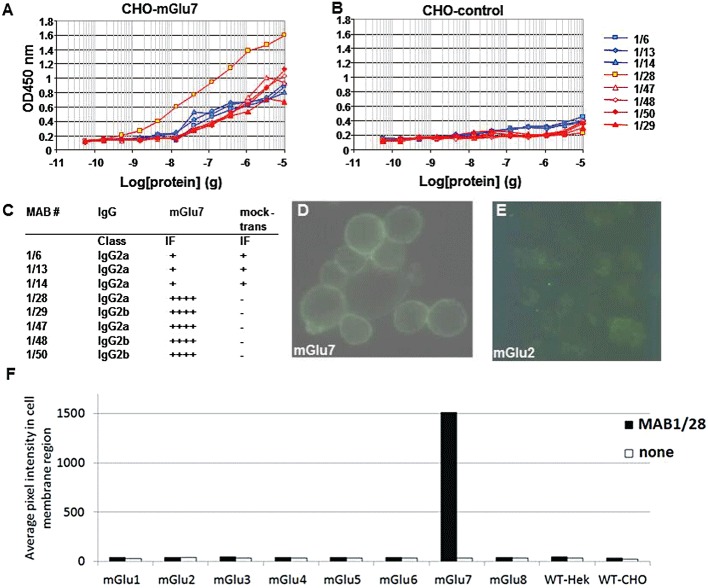
Background and purpose: The mGlu(7) receptors are strategically located at the site of vesicle fusion where they modulate the release of the main excitatory and inhibitory neurotransmitters. Consequently, they are implicated in the underlying pathophysiology of CNS diseases such as epilepsy and stress-related psychiatric disorders. Here, we characterized a selective, potent and functional anti-mGlu(7) monoclonal antibody, MAB1/28, that triggers receptor internalization.

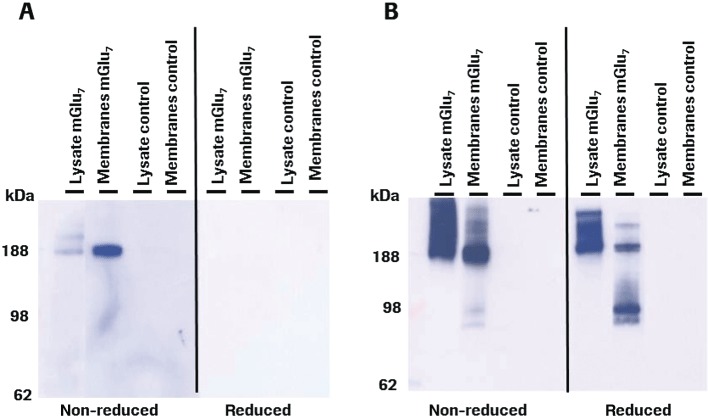
Experimental approach: MAB1/28's activity was investigated using Western blot and direct immunofluorescence on live cells, in vitro pharmacology by functional cAMP and [(35) S]-GTPγ binding assays, the kinetics of IgG-induced internalization by image analysis, and the activation of the ERK1/2 by elisa.

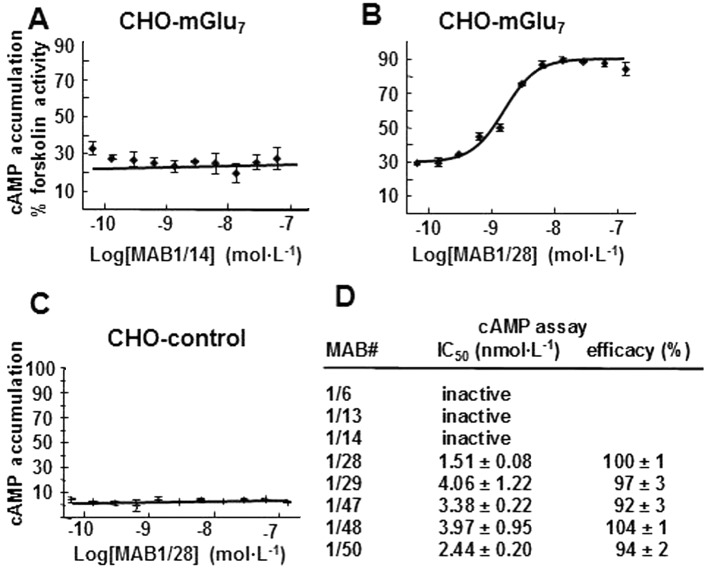
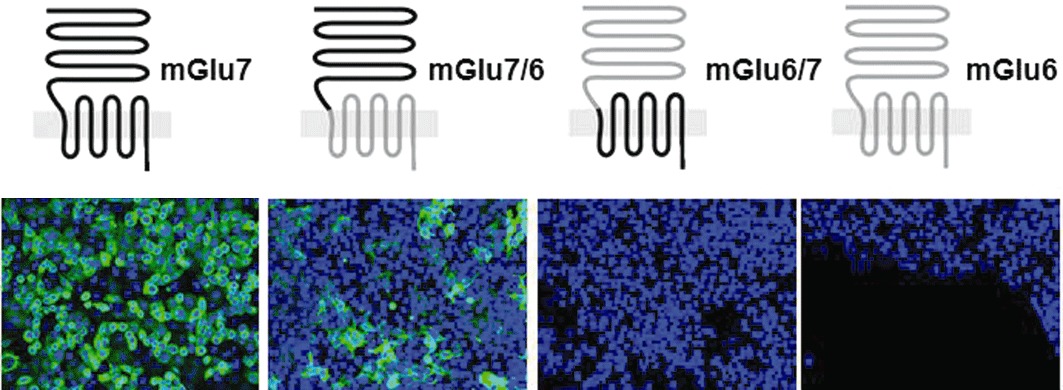
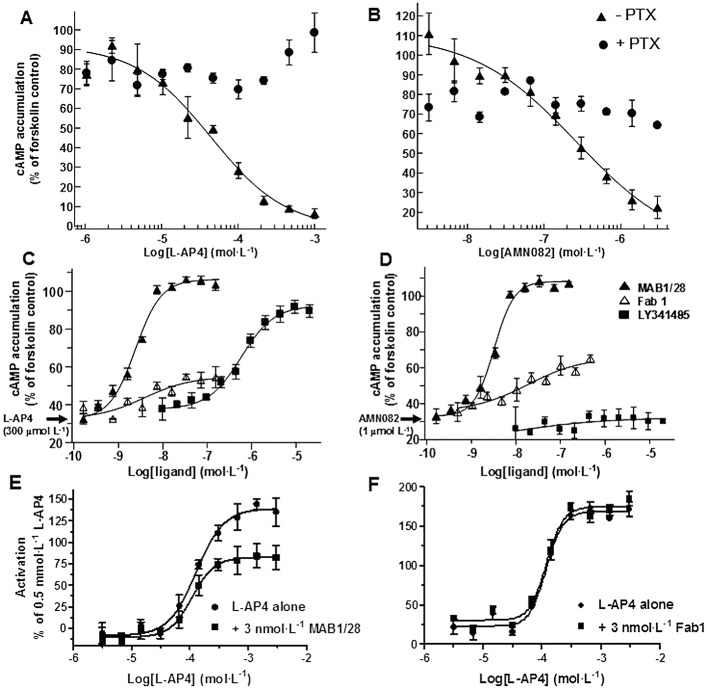
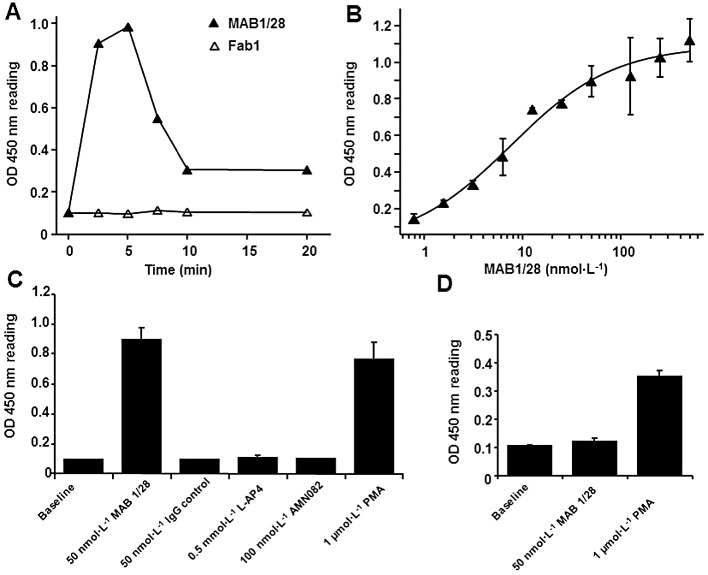
Key results: mGlu(7) /mGlu(6) chimeric studies located the MAB1/28 binding site at the extracellular amino-terminus of mGlu(7) . MAB1/28 potently antagonized both orthosteric and allosteric agonist-induced inhibition of cAMP accumulation. The potency of the antagonistic actions was similar to the potency in triggering receptor internalization. The internalization mechanism occurred via a pertussis toxin-insensitive pathway and did not require Gα(i) protein activation. MAB1/28 activated ERK1/2 with potency similar to that for receptor internalization. The requirement of a bivalent receptor binding mode for receptor internalizations suggests that MAB1/28 modulates mGlu(7) dimers.

Conclusions and implications: We obtained evidence for an allosteric-biased agonist activity triggered by MAB1/28, which activates a novel IgG-mediated GPCR internalization pathway that is not utilized by small molecule, orthosteric or allosteric agonists. Thus, MAB1/28 provides an invaluable biological tool for probing mGlu(7) function and selective activation of its intracellular trafficking.


Figures

Figure 1
Figure 1
Characterization of mGlu7 MABs. elisa analyses of MABs using membrane preparations from CHO-DUKX-CRE-luci-rmGlu7a stable cell line 83 (A) and non-transfected CHO-DUKX-CRE-luci control cells (B). IgG classification and immunofluorescence analyses of MABs using CHO mGlu7 expressing cells or the CHO cells mock transfected with plasmid (expressing GPR40 protein) as a negative control, and FITC-rabbit anti-mouse IgG as secondary antibody are summarized in (C). IF on live CHO-DUKX-CRE-luci-rmGlu7a cell line 83 (D) and CHO-DUKX-CRE-luci-rmGlu2 cell line 17, which was used as a negative control for selectivity (E) by MAB1/28 using FITC-rabbit anti-mouse IgG as secondary antibody. (F) Live cells expressing the mGlu receptors 1–8 were stained with the primary antibody MAB1/28. After fixation, the immunostain was visualized with Alexa647-conjugated secondary antibody. The staining intensity at the cell membrane region was identified using high content analysis and the average immunostain pixel intensity calculated. The bars show average immunostain intensity for the cell population. The data are representative of two independent experiments.
Figure 2
Figure 2
Pharmacological characterization of MABs in the cAMP assay. Concentration–response curve (CRC) of the MAB1/14 (A) and MAB1/28 (B) in the CHO rmGlu7 expressing stable line and of the MAB1/28 in the non-transfected CHO control cells (C). Cells were stimulated with 3 µmol·L−1 forskolin, an EC80 of L-AP4 and various concentrations of IgG MABs. The cellular content of cAMP was measured and expressed as % cAMP content compared to cells treated with 3 µmol·L−1 forskolin only. (D) The IC50 and efficacy values for various MABs were calculated from CRCs as described in the Methods. All measurements were performed in duplicate and values represent the mean ± SD.
Figure 3
Figure 3
Western blot analysis. Samples containing cell lysate or membrane preparation from the CHO rmGlu7 expressing stable line 83 or non-transfected CHO control cells under non-reduced or reduced conditions were loaded on 4–12% Nupage gel. (A) Blot incubated with anti-mGlu7 MAB1/28 (mouse monoclonal IgG). (B) Blot incubated with anti-mGlu7 rabbit polyclonal IgG from Upstate. A POD-labelled goat anti-mouse or anti-rabbit IgG antibody was used as a secondary antibody. The exposure times were 1 min and 5 s for mouse MAB1/28 and rabbit polyclonal antibodies respectively.
Figure 4
Figure 4
Immunofluorescence on cells expressing wild-type or chimeric rmGlu6 or rmGlu7 constructs. Cells were stained after fixation and permeabilization with MAB1/28-IgG followed by secondary antibody labelled with Alexa Fluor 647. In the top panel the predicted receptor topology is indicated relative to the membrane with the large extracellular domain at the top, with the mGlu6 part in grey and mGlu7 in black. Shown are representative overlaid images of immunostain (green) and nuclear stain (blue) acquired at 20 × magnification using same exposure parameters for the different are shown.
Figure 5
Figure 5
Staining of MAB1/28 in rodent brain sections. Indirect immunofluorescence staining with MAB1/28 revealed specific localization of mGlu7 in the hippocampal formation as shown in an overview for rat brain (A) and in more detail for mouse brain with highest immunoreactive signals in stratum oriens (SO), stratum radiatum (SR) and hilus (hi) (B). Scale bars: 250 µm (white horizontal line in B). Immunoreactivity of MAB1/28 in the enlarged hippocampus of mGlu7+/+ wild-type mouse brain (C) and lack of MAB1/28 immunostaining in mGlu7−/− knockout littermate mouse brain (D).
Figure 6
Figure 6
Comparison of MAB1/28 and Fab1 fragments induced mGlu7 internalization. Direct immunofluorescence on live CHO-DUKX-CRE-luci-rmGlu7a stable cell line 83 (A) and non-transfected CHO-DUKX-CRE-luci control cells (I) by MAB1/28-Alexa488. E, tertiary protein structure of 1/28 type of antibody. Indicated is the papain enzyme cleavage site used for generation of monovalent Fab1 fragments. Images of CHO mGlu7 expressing cells which have been incubated with 33 nmol·L−1 MAB1/28 as primary antibody (B–D), 67 nmol·L−1 Fab1 fragments (F–H) or with no primary antibody or Fab1 fragments (J–K) at 37°C before being washed and transferred to ice for secondary staining and fixation as described in the protocol. Each row contains images acquired in parallel of the same field of view in the well. (B, F and J) Images acquired with filter settings selective for TrueBlue and Hoechst 33258 stain (laser 405 nm, emission reflected by long path 650 filter, filtered through short path 568 filter and band path 455/70 filter). (C, G and K) Images acquired with filter settings selective for the cell surface stain with Alexa532 secondary antibody (laser 532 nm, emission reflected by LP650 and filtered through LP568 and BP586/40). (D, H and L) Images acquired with filter settings selective for the whole cell stain with Alexa647 secondary antibody after membrane permeabilization (laser 635 nm, emission passing through LP650 and filtered through BP690/50). The range of the pixel intensity grey scale ranging from black to white is indicated in lower left corner of the individual images. (M, N) The quantified surface staining and cytoplasmic spot intensity for, respectively, MAB1/28 and Fab1 fragments. Average pixel intensity in cell surface stain (M) and pixel intensity in cytoplasmic spots per cytoplasmic area (N).
Figure 7
Figure 7
Image-based analysis of MAB1/28 internalization. (A) Cell surface (green; Alexa532, secondary antibody) and intracellular (red; Alexa647, secondary antibody after permeabilization) staining by MAB1/28 in the CHO mGlu7 expressing cells. (B and C) Dose–response curves with different concentrations of MAB1/28 and Fab1 for plasma membrane staining and receptor-induced internalization. Average pixel intensity in cell surface stain (B) and pixel intensity in cytoplasmic spots per cytoplasmic area (C) are indicated. Each point is the average of three wells, shown as the mean ± SD. The graph is a representative of two independent experiments.
Figure 8
Figure 8
The kinetics of uptake of MAB1/28 and Fab1 fragments, and effect of pertussis toxin. Time course of pixel intensity in cell surface stain (A) and pixel intensity in cytoplasmic spots per cytoplasmic area (B) for MAB1/28 (22 nmol·L−1)- and Fab1 fragments (33 nmol·L−1)- induced receptor internalization in the stable CHO mGlu7 expressing cells. The curve is representative of two independent experiments shown as mean ± SDM, each experiment carried out in triplicate. The effect of PTX pre-incubation on kinetic of MAB1/28 and Fab1 receptor-binding and internalization of mGlu7 is also shown.
Figure 9
Figure 9
Functional characterization of MAB1/28 and Fab1 fragments in cAMP and [35S]-GTPγ binding assays. Concentration–response curve of L-AP4 (A) and AMN082 (B) in the absence and presence of PTX in the CHO mGlu7 expressing stable cell line 83. Cells were stimulated with 3 µmol·L−1 forskolin, and various concentrations of L-AP4 or AMN082. Concentration–dependent inhibition of 300 µmol·L−1 L-AP4 (C) and 1 µmol·L−1 AMN082 (D) by MAB1/28, Fab1 fragments or LY341495 in the CHO line 83 cells. Cells were stimulated with 3 µmol·L−1 forskolin, an EC80 of L-AP4 or AMN082 and various concentrations of MAB1/28, Fab1 or LY341495. The cellular content of cAMP was measured and expressed as % cAMP content compared to cells treated with 3 µmol·L−1 forskolin only. Concentration–response curves for L-AP4-induced [35S]-GTPγ binding in the membranes from CHO mGlu7 cell line 83, in the absence and in the presence of 3 nmol·L−1 MAB1/28 (E) and in the absence and in the presence of 3 nmol·L−1 Fab1 fragments (F). All measurements were performed in triplicate and values represent mean ± SEM.
Figure 10
Figure 10
MAB1/28-mediated p44/42 MAPK (ERK1/2) phosphorylation. (A) A typical example of time course of p44/42 MAPK activation induced upon treatment with the 50 nmol·L−1 MAB1/28 in the CHO mGlu7 expressing stable cell line 83. The phospho-p44/42 MAPK levels were determined by means of the PathScan Phospho-p44/42 MAPK Sandwich elisa kit according to instructions of the manufacturer. Fab1 fragments had no effect on phospho-p44/42 MAPK level. (B) Increasing doses of MAB1/28 induced saturable levels of phospho-p44/42 MAPK 5 min after treatment of CHO cells expressing mGlu7 receptors. (C) The specificity of the MAB1/28-induced levels of phospho-p44/42 MAPK after treatment of CHO cells expressing mGlu7 receptors. (D) The effect on the levels of phospho-p44/42 MAPK of treatment with the MAB1/28 in the non-transfected CHO cells. The values represent the mean ± SEM from three measurements, each performed in triplicate.

Similar articles

Cited by

References

    1. Acher FC, Selvam C, Pin JP, Goudet C, Bertrand HO. A critical pocket close to the glutamate binding site of mGlu receptors opens new possibilities for agonist design. Neuropharmacology. 2011;60:102–107. - PubMed
    1. Airas JM, Betz H, El Far O. PKC phosphorylation of a conserved serine residue in the C-terminus of group III metabotropic glutamate receptors inhibits calmodulin binding. FEBS Lett. 2001;494:60–63. - PubMed
    1. Alexander SP, Mathie A, Peters JA. Guide to receptors and channels (GRAC), 5th edn. Br J Pharmacol. 2011;164(Suppl 1):S1–324. - PMC - PubMed
    1. Aplin M, Christensen GL, Schneider M, Heydorn A, Gammeltoft S, Kjolbye AL, et al. Differential extracellular signal-regulated kinases 1 and 2 activation by the angiotensin type 1 receptor supports distinct phenotypes of cardiac myocytes. Basic Clin Pharmacol Toxicol. 2007;100:296–301. - PubMed
    1. Bennett TA, Maestas DC, Prossnitz ER. Arrestin binding to the G protein-coupled N-formyl peptide receptor is regulated by the conserved ‘DRY’ sequence. J Biol Chem. 2000;275:24590–24594. - PubMed

Substances