Comparative Study
. 2012 Jun 29:5:28.
doi: 10.1186/1755-8794-5-28.

A systematic comparison and evaluation of high density exon arrays and RNA-seq technology used to unravel the peripheral blood transcriptome of sickle cell disease

Affiliations
Comparative Study

A systematic comparison and evaluation of high density exon arrays and RNA-seq technology used to unravel the peripheral blood transcriptome of sickle cell disease

Nalini Raghavachari et al. BMC Med Genomics. .

Abstract

Background: Transcriptomic studies in clinical research are essential tools for deciphering the functional elements of the genome and unraveling underlying disease mechanisms. Various technologies have been developed to deduce and quantify the transcriptome including hybridization and sequencing-based approaches. Recently, high density exon microarrays have been successfully employed for detecting differentially expressed genes and alternative splicing events for biomarker discovery and disease diagnostics. The field of transcriptomics is currently being revolutionized by high throughput DNA sequencing methodologies to map, characterize, and quantify the transcriptome.

Methods: In an effort to understand the merits and limitations of each of these tools, we undertook a study of the transcriptome in sickle cell disease, a monogenic disease comparing the Affymetrix Human Exon 1.0 ST microarray (Exon array) and Illumina's deep sequencing technology (RNA-seq) on whole blood clinical specimens.

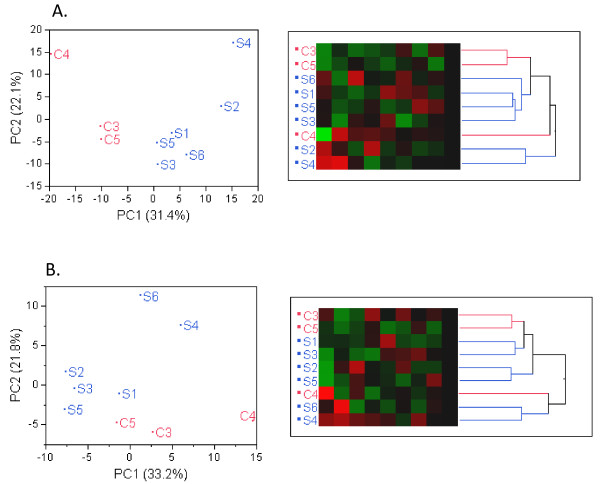
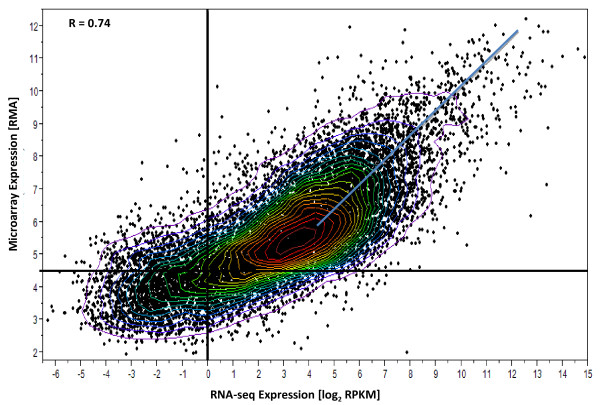
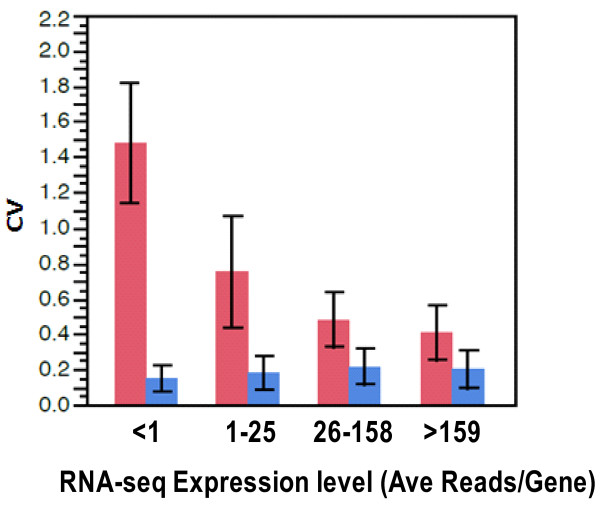
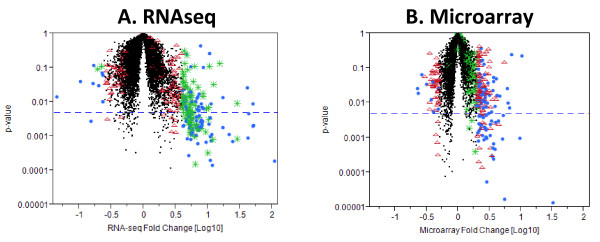
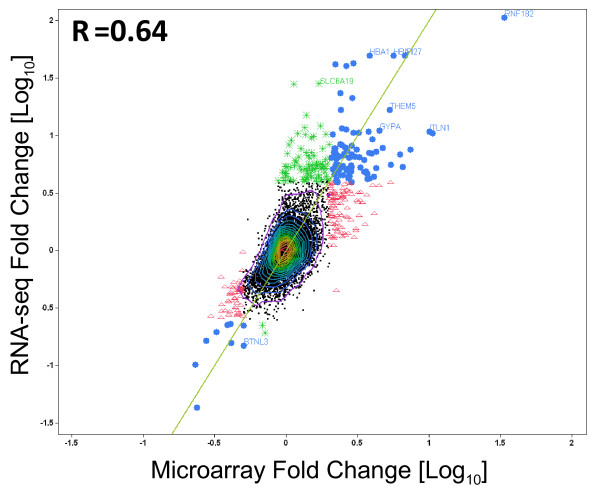
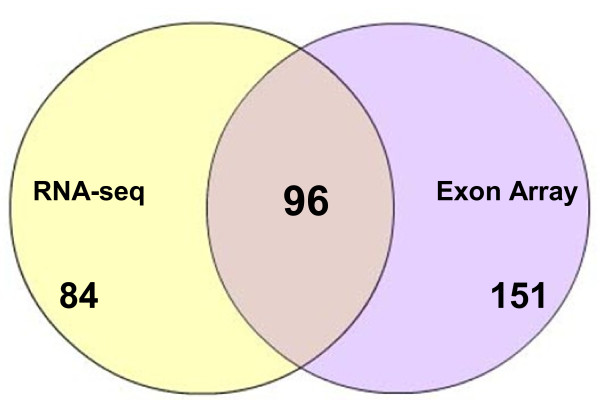
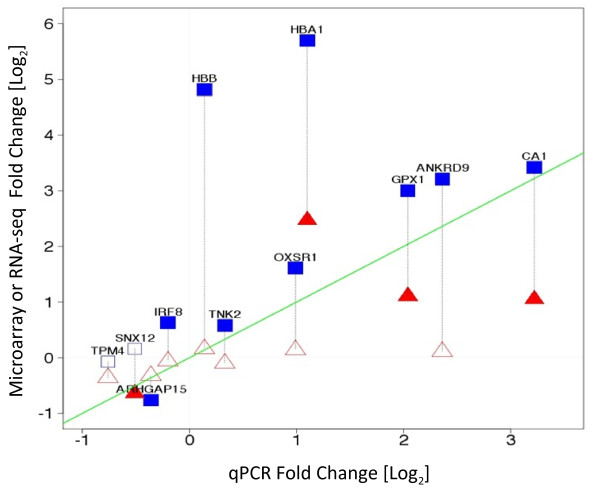
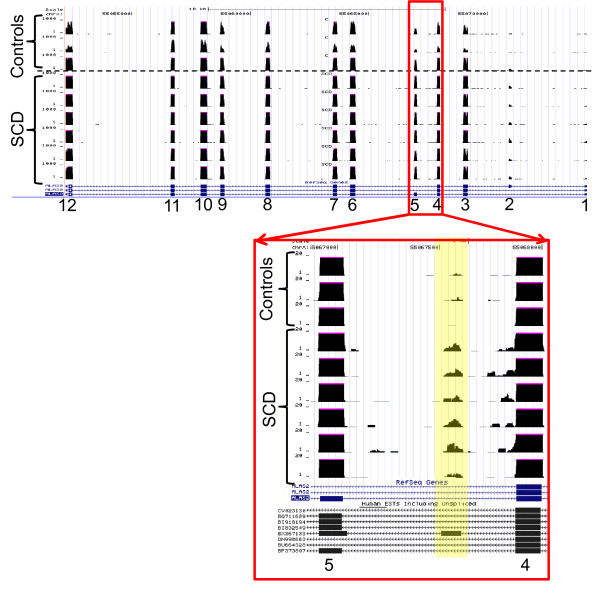
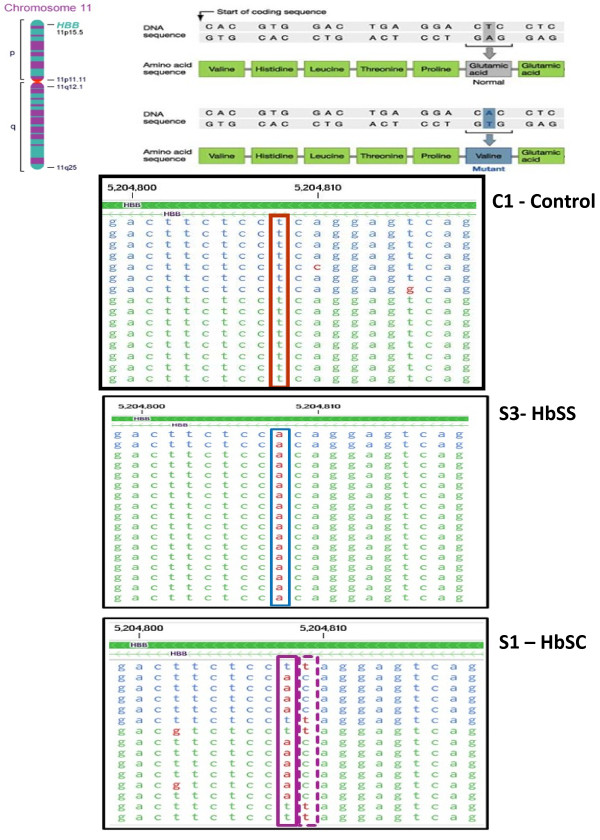
Results: Analysis indicated a strong concordance (R = 0.64) between Exon array and RNA-seq data at both gene level and exon level transcript expression. The magnitude of differential expression was found to be generally higher in RNA-seq than in the Exon microarrays. We also demonstrate for the first time the ability of RNA-seq technology to discover novel transcript variants and differential expression in previously unannotated genomic regions in sickle cell disease. In addition to detecting expression level changes, RNA-seq technology was also able to identify sequence variation in the expressed transcripts.

Conclusions: Our findings suggest that microarrays remain useful and accurate for transcriptomic analysis of clinical samples with low input requirements, while RNA-seq technology complements and extends microarray measurements for novel discoveries.


Figures

Figure 1
Figure 1
Principal component analysis and hierarchical clustering (A) RNA-seq data. Principal Component 1 (PC1, x-axis) represents 31.4% and PC2 (y-axis) represents 22.1% of total variation in the data. Hierarchical cluster of 9 samples with heatmap representing all 9 PCs in left-to-right order. (B). Exon array data. PC1 vs. PC2 on Exon array data together representing 33.2% and 21.8% of the data variability. Hierarchical clustering shows similarities to that in A, e.g. sample C4 departs strongly from remaining data, samples C3, C5 appear to be neighbors in both data sets.
Figure 2
Figure 2
Comparison of Gene Expression Measurements by Two Methods. Gene Microarray expression level (RMA) vs. RNA-seq expression level (log2 RPKM) for subject C3. Both axes are expressed in base 2 logarithmic scale. The dynamic range (ratio of largest observable value to apparent background value) of the RNA-seq data is clearly larger than that of Exon array data. Bivariate density contours indicate a strong but nonlinear correlation between the two measurements. The two methods yield nearly proportional results above the median expression levels (Blue line). Solid Black lines are detection limits for microarray (RMA = 4.5) and RNA-seq (log2RPKM =0). Refer Methods for the description of detection limits.
Figure 3
Figure 3
Coefficient of Variation (CV) versus expression level for microarray and RNA-seq. RNA-seq expression level is grouped inot 4 bins according to RNA-seq average number of reads per gene lesser than1, 1–25, 26–158, 159 or higher. CV is calculated as sample standard deviation of expression level within group (SCD and control), pooled and dvidied by mean expression level for RNA-seq (Red). For microarray (Blue), the expression values (RMA units) are first divided by ln (2) = 0.693 to convert them to a natural log scale. Then the CV is calculated as the pooled standard deviation of natural log of the expression levels.
Figure 4
Figure 4
Volcano plots for RNA-seq and Exon array. (A). p-value vs. log10 fold change (SCD vs. control) for RNA-seq data.(B). p-value vs. log10 fold change for Affymetrix human Exon array data. Points in the lower right and lower left hand corners of the plots represent transcript clusters that are significant and differentially expressed. ●Blue circles represent transcripts with a FC greater or equal to 4 in RNA-seq and Δ Red triangles represent FC greater or equal to 2 in Exon arrays. *Green asterisks represent transcripts with a FC greater than or equal to 4 on RNA-seq only.
Figure 5
Figure 5
Fold change for RNA-seq vs. fold change for Exon array (SCD vs Control). A total of 331 transcript clusters are highlighted in the figure. The 96 blue circles ● represent transcripts with a FC greater than or equal to 4 in RNA-seq and a FC greater than or equal to 2 in microarray. The 151 red triangles ▴ represent transcripts with a fold change greater than or equal to 2 on microarray only. The 84 green asterisks * represent transcripts with a fold change greater than or equal to 4 in RNA-seq only. Correlation coefficient, R = 0.64. Genes showing greater than 4 fold change in expression levels were selected as differentially expressed in RNA-seq and genes showing greater than 2 fold change in expression levels were selected as differentially expressed in microarrays.
Figure 6
Figure 6
Venn diagram showing the 331 differentially expressed genes between SCD and Healthy Controls for RNA-seq and microarray. Gene selection Criteria for RNA-Seq -FC greater than or equal to 4; Exon array -FC greater than or equal to 2.
Figure 7
Figure 7
Validation by QPCR - Log2 expression fold change (SCD vs. Control) measured by microarray (Red) or RNA-seq (Blue) vs. qPCR on selected genes. Closed symbols represent significant changes, open signals are not significant. The green line is the line of identity. Symbols closer to the line of identity are in better agreement with QPCR. ▴Significantly differentially expressed genes by microarray, ■Significantly differentially expressed genes by RNA-seq; Δ No significance in microarray; □No significance in RNA-seq.
Figure 8
Figure 8
Coverage Plot of RNA-seq data forALAS2 gene RNA-seq reads forALAS2 gene are shown in genomic context (chrX:55,051,744-55,074,222). An apparently novel exon dubbed 4a, between exons 4 and 5 is expressed significantly more in SCD compared with controls (p = 0.0003). This exon has been previously observed as human EST BX367133, in a clone derived from T cells. The inset shows the region bounded by exons 4 and 5 with the coverage range expanded and truncated to 20 for each track.
Figure 9
Figure 9
Analysis of sequence variants in the expressed hemoglobin transcript in a Healthy Control – (C1), and Homozygous (S3-HbSS) and Heterozygous (S1-HbSC) Sickle Cell Patients Observed sequences of HBB (hemoglobin B) gene in the region including the known sickle cell mutation, which causes a substituion of valine (coded by CAC) for glutamic acid (coded by CTC). The box for the reads from sample C1 - control, show the observed sequences (on the coding strand, but in reversed order) and are consistently T at the mutation position. The box for sample S3 - HbSS shows the consistent substitution of A at this same position. The box for sample S1 - HbSC show approximately 50% substitution of A for T at this position, and an additional mutation at the neighboring postion C- > T. This sample was revealed to be from a compound heterozygous hemoglobin SC patient.

Similar articles

Cited by

References

    1. Melton SD, Genta RM, Souza RF. Biomarkers and molecular diagnosis of gastrointestinal and pancreatic neoplasms. Nat Rev Gastroenterol Hepatol. 2010;7(11):620–628. - PMC - PubMed
    1. Rudan I. New technologies provide insights into genetic basis of psychiatric disorders and explain their co-morbidity. Psychiatr Danub. 2010;22(2):190–192. - PubMed
    1. Weitzel JN, Blazer KR, Macdonald DJ, Culver JO, Offit K. Genetics, genomics, and cancer risk assessment: State of the Art and Future Directions in the Era of Personalized Medicine. CA Cancer J Clin. 2011;61(5):327–359. - PMC - PubMed
    1. Yang X, Jiao R, Yang L, Wu LP, Li YR, Wang J. New-generation high-throughput technologies based 'omics' research strategy in human disease. Yi Chuan. 2011;33(8):829–846. - PubMed
    1. Offit K. Personalized medicine: new genomics, old lessons. Hum Genet. 2011;130(1):3–14. - PMC - PubMed

Publication types