. 2012 Jun 29:13:154.
doi: 10.1186/1471-2105-13-154.

TAPDANCE: an automated tool to identify and annotate transposon insertion CISs and associations between CISs from next generation sequence data

Affiliations

TAPDANCE: an automated tool to identify and annotate transposon insertion CISs and associations between CISs from next generation sequence data

Aaron L Sarver et al. BMC Bioinformatics. .

Abstract

Background: Next generation sequencing approaches applied to the analyses of transposon insertion junction fragments generated in high throughput forward genetic screens has created the need for clear informatics and statistical approaches to deal with the massive amount of data currently being generated. Previous approaches utilized to 1) map junction fragments within the genome and 2) identify Common Insertion Sites (CISs) within the genome are not practical due to the volume of data generated by current sequencing technologies. Previous approaches applied to this problem also required significant manual annotation.

Results: We describe Transposon Annotation Poisson Distribution Association Network Connectivity Environment (TAPDANCE) software, which automates the identification of CISs within transposon junction fragment insertion data. Starting with barcoded sequence data, the software identifies and trims sequences and maps putative genomic sequence to a reference genome using the bowtie short read mapper. Poisson distribution statistics are then applied to assess and rank genomic regions showing significant enrichment for transposon insertion. Novel methods of counting insertions are used to ensure that the results presented have the expected characteristics of informative CISs. A persistent mySQL database is generated and utilized to keep track of sequences, mappings and common insertion sites. Additionally, associations between phenotypes and CISs are also identified using Fisher's exact test with multiple testing correction. In a case study using previously published data we show that the TAPDANCE software identifies CISs as previously described, prioritizes them based on p-value, allows holistic visualization of the data within genome browser software and identifies relationships present in the structure of the data.

Conclusions: The TAPDANCE process is fully automated, performs similarly to previous labor intensive approaches, provides consistent results at a wide range of sequence sampling depth, has the capability of handling extremely large datasets, enables meaningful comparison across datasets and enables large scale meta-analyses of junction fragment data. The TAPDANCE software will greatly enhance our ability to analyze these datasets in order to increase our understanding of the genetic basis of cancers.


Figures

Figure 1
Figure 1
Visual summary of the TAPDANCE process. Libraries of inserts from sets of mouse tumors are generated and sequenced. Barcode, IRDR and linker sequences are trimmed, and the remaining genomic sequence is mapped to the genome. Regions of insertions overrepresented within the genome and the statistical probablility of observing such events are determined in an automated manner allowing the comparison and contrasting of multiple datasets. Genomic loci may be common among many mice (e.g. F) or just a subset with a common observed phenotype or inherent genotype (e.g., G).
Figure 2
Figure 2
TAPDANCE database schema and processing flowchart. Overview of the TAPDANCE process. Input files are loaded into the database tables named with the project id. SQL and perl functions are used to identify library of origin, genomic sequence, remove duplicate sequences and to allow insert location identification using the bowtie mapping algorithm. This mapping process is iterative in the first iteration sequences > 33 bp are mapped allowing 3 mismatches. Anything that did not map in the first round was remapped following removal of the 3’UTR to leave only 33 bases in the second round. Similarly in the 3rd round remaining unmapped sequences of 30 bp were mapped allowing 2 mismatches. In the 4 th round previously unmapped sequences of length 28 bp were mapped with 1 mismatch. Finally previously unmapped sequences of length 24 bp are mapped with 0 mismatches. The mapped data is summarized and finally exported by the TAPDANCE.pl script using configurable data stored in the config.pl script including barcodes and insertion derived sequences. The TAP2.pl scripts assembles sets of inserts, conducts CIS analyses, Co-CIS and Pheno-CIS analyses resulting in exportable files containing relevant information. All file locations are shown relative to root and additional intermediate tables are generated during processing as documented within the various scripts and dependencies. Persistent tables and results files are named using the $proj variable which is set in the config.pl file.
Figure 3
Figure 3
Genomic mapping and sequence length. Randomly generated sets of 50,000 (A|G|C|T) sequences of varying lengths described on the X-axis were mapped to the mouse genome using bowtie. The total number of mappings of each sequence that either mapped to no region (black triangle) mapped to multiple regions (blue diamond) or mapped to a single region (red square) were plotted for each sequence length using bowtie mapping software allowing A) 3mismatches B) 2 mismatches C) 1 mismatch and D) 0 mismatches. At intermediate sequence lengths for a fixed number of mismatches, ~20 % of randomly generated sequences were capable of uniquely mapping to the genome.
Figure 4
Figure 4
SB transposon mapping and Orientation.A) The SB transposon is asymmetric and can map in either + or – orientation within specific TA sites. B) Genomic region after insertion of SB transposon in either + orientation (red) capable of driving transcription of genes encoded on the positive strand or in – orientation (blue) capable of driving genes encoded on the – strand. In either direction a splice site acceptor is available, leading to transcript disruption. PCR products derived from SB junction fragments are capable of determining which orientation the transposon has integrated. The sets of primers i-iv indicate how the PCR products are obtained. Each of the transposon side primers contains a library specific barcode to allow multiplexing during the sequencing process.
Figure 5
Figure 5
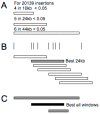
Window sizes, CIS calculation and resolution of overlapping CISs.A) Based on the total number of insertions being analysed for CISs, Window sizes (10,000-301,000 bp) are calculated to define the largest window size which is capable of showing a significant CIS (Poisson distribution p-value < 0.05 following bonferroni correction based on total window size) using total insertion numbers which can only exist as integer values. Only the first 3 window sizes for 20139 insertions are shown here. B) For each of the window sizes the p-value is calculated for each possible window based on the total number of insertions starting with every insertion throughout the genome. Non-overlapping windows with the lowest p-value (most insertions) are then chosen for each window size where the p-value is below a user-defined threshold. C) In order to combine the different window sizes, non-overlapping windows with the lowest p-value are chosen and these are returned as CISs. In the case shown, the 24 kb window with 7 insertions had a lower p-values than best 44 kb window and the best 10 kb window within the region.
Figure 6
Figure 6
Insert counting methods for p-value calculation. Three different methods of counting the number of insertions within a given CIS are used by the software in order to remove potential artifacts from the final CIS list. In the figure 10 transposon insertions from 6 different tumor libraries are shown. The number of insertions can be derived 1) from the total number of inserts 2) the total number of libraries within the CIS and 3) the total number of unique regions within a cis that hold an insertion. The total number of inserts obtained by these 3 counting methods are then indivually used to test the null hypothesys that no enrichment is present using the Poisson distribution based on the window size, the genome size and the total number of inserts present in the dataset being examined. We expect Bonferroni corrected p-values to be less than 0.05 for each of these 3 methods of counting in order to define ideal CIS.
Figure 7
Figure 7
Analyses of colon cancer data set.A) CISs on chromosome 18, identified by the TAPDANCE system visualized by IGV , The x-axis shows the position on chromosome 18 and the y-axis shows the –log of the p-value. B) Zoomed in visualization of the Wac CIS region on chromosome 18. The CIS region, the intron exon boundaries of WAC and the actual transposon insertion regions are shown. C) A further zoomed-in 1000 bp region of the WAC CIS showing further detail regarding the transposon insertion orientation as well as the raw read mappings that were used for the CIS region calls.
Figure 8
Figure 8
Genome-wide association of phenotypes and CISs.A) Genome-wide map of CISs calculated using all tumors, colon tumors or liver tumors. The –log base 10 of the CISs p-value is plotted with an upper threshold of 16. B)Heat map of CISs with p-value > 10-5 calculated using all tumors. The header bar indicates colon tumors in dark grey and liver tumors in light grey. Transposon insertions in CIS regions within a given library are indicated by red boxes in the first panel. In the second panel the Fisher’s exact test p-value has been converted to the –log base 10 is plotted as a heatmap with increasing yellow intensity showing increased statistical significance. The CIS containing the Apc gene is highly significantly associated with colon tumors, while a CIS containing the Egfr gene is highly associated with the liver tumors. Actual p-values for association are provided in Additional file 1: Table S6.

Similar articles

Cited by

References

    1. St Johnston D. The art and design of genetic screens: Drosophila melanogaster. Nat. Rev. Genet. 2002;3:176–188. doi: 10.1038/nrg751. - DOI - PubMed
    1. Uren AG, Kool J, Berns A, van Lohuizen M. Retroviral insertional mutagenesis: past, present and future. Oncogene. 2005;24:7656–7672. doi: 10.1038/sj.onc.1209043. - DOI - PubMed
    1. Collier LS, Carlson CM, Ravimohan S, Dupuy AJ, Largaespada DA. Cancer gene discovery in solid tumours using transposon-based somatic mutagenesis in the mouse. Nature. 2005;436:272–276. doi: 10.1038/nature03681. - DOI - PubMed
    1. Starr TK, Allaei R, Silverstein KAT, Staggs RA, Sarver AL, Bergemann TL, Gupta M, O’Sullivan MG, Matise I, Dupuy AJ, Collier LS, Powers S, Oberg AL, Asmann YW, Thibodeau SN, Tessarollo L, Copeland NG, Jenkins NA, Cormier RT, Largaespada DA. A transposon-based genetic screen in mice identifies genes altered in colorectal cancer. Science. 2009;323:1747–1750. doi: 10.1126/science.1163040. - DOI - PMC - PubMed
    1. Keng VW, Villanueva A, Chiang DY, Dupuy AJ, Ryan BJ, Matise I, Silverstein KAT, Sarver A, Starr TK, Akagi K, Tessarollo L, Collier LS, Powers S, Lowe SW, Jenkins NA, Copeland NG, Llovet JM, Largaespada DA. A conditional transposon-based insertional mutagenesis screen for genes associated with mouse hepatocellular carcinoma. Nat. 2009;27:264–274. doi: 10.1038/nbt.1526. - DOI - PMC - PubMed

Substances

LinkOut - more resources