Review
. 2012:83:219-98.
doi: 10.1016/B978-0-12-394438-2.00006-2.

Bacteriophage protein-protein interactions

Affiliations
Review

Bacteriophage protein-protein interactions

Roman Häuser et al. Adv Virus Res. 2012.

Abstract

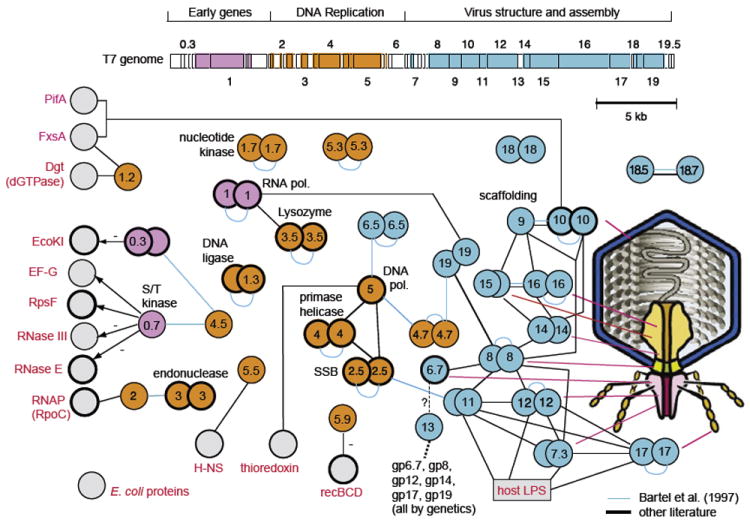
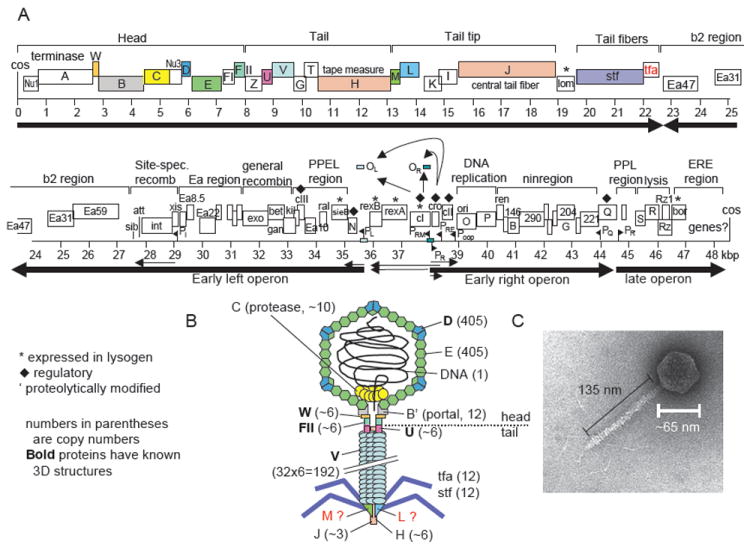
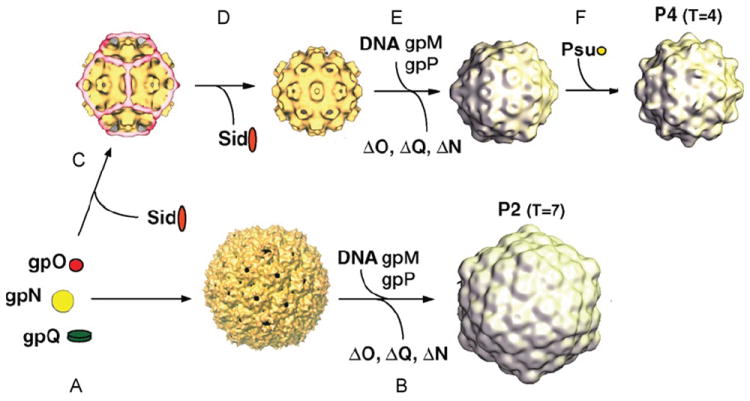
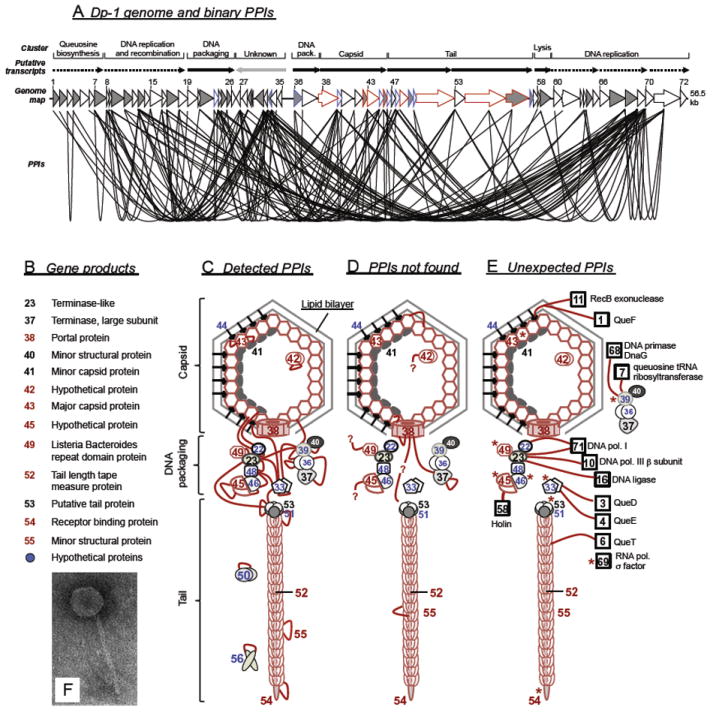
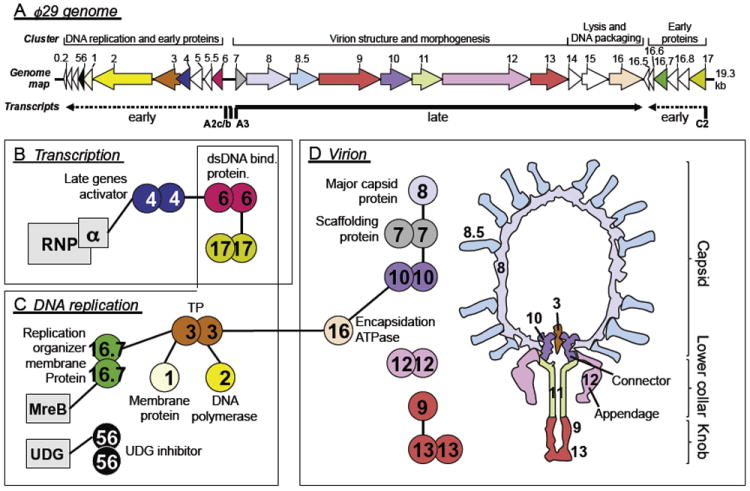
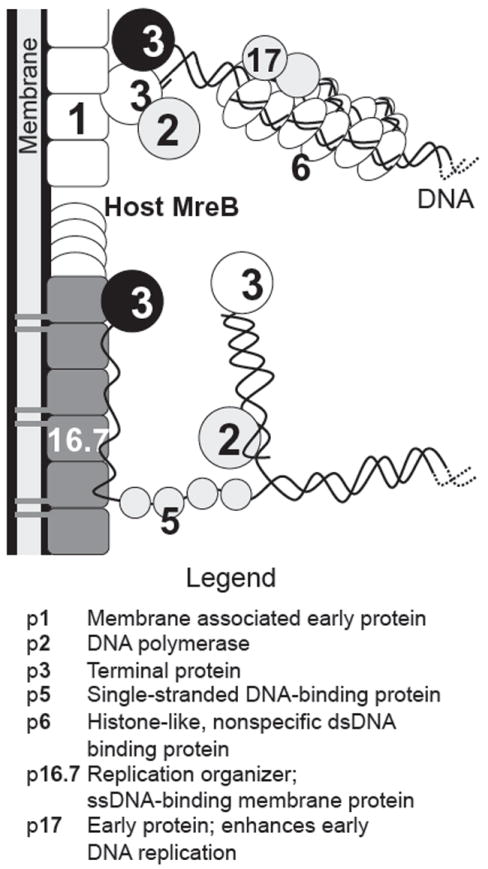
Bacteriophages T7, λ, P22, and P2/P4 (from Escherichia coli), as well as ϕ29 (from Bacillus subtilis), are among the best-studied bacterial viruses. This chapter summarizes published protein interaction data of intraviral protein interactions, as well as known phage-host protein interactions of these phages retrieved from the literature. We also review the published results of comprehensive protein interaction analyses of Pneumococcus phages Dp-1 and Cp-1, as well as coliphages λ and T7. For example, the ≈55 proteins encoded by the T7 genome are connected by ≈43 interactions with another ≈15 between the phage and its host. The chapter compiles published interactions for the well-studied phages λ (33 intra-phage/22 phage-host), P22 (38/9), P2/P4 (14/3), and ϕ29 (20/2). We discuss whether different interaction patterns reflect different phage lifestyles or whether they may be artifacts of sampling. Phages that infect the same host can interact with different host target proteins, as exemplified by E. coli phage λ and T7. Despite decades of intensive investigation, only a fraction of these phage interactomes are known. Technical limitations and a lack of depth in many studies explain the gaps in our knowledge. Strategies to complete current interactome maps are described. Although limited space precludes detailed overviews of phage molecular biology, this compilation will allow future studies to put interaction data into the context of phage biology.


Figures

FIGURE 1
FIGURE 1
Selected methods for the study of protein–protein interactions. (A) The yeast two-hybrid (Y2H) system is based on the levels of two fusion proteins (typically in yeast but any cell type can be used). One of the proteins contains a DNA-binding domain (DBD), which can bind to the promoter of a reporter gene (here: HIS3), and a second protein X, the bait. The second fusion protein consists of a transcription-activation domain (AD) and a second protein, Y. If proteins X and Y interact, a transcription factor is formed and the reporter gene is activated. In this case, that means that the cell can grow on histidine-free medium. A yeast colony growing on such medium thus indicates an interaction of the two inserted proteins. (B) Protein complementation assay (PCA), e.g., split-YFP. As in the Y2H assay, two interacting proteins bring together two protein fragments that are inactive when separate but active when in close proximity. Here, fragments of yellow-fluorescent protein (YFP) reassociate and fluoresce when reassembled. Other fluorescent proteins, such as the green fluorescent protein (GFP), have been used in a similar way. (C) LUMIER (LUMInescence-based mammalian intERactome). Two fusion proteins are purified by means of an epitope tag (here: FLAG tag), usually on an antibody-coated matrix. Interactions between X and Y can be detected using Luciferase, whose gene is fused to Y and which emits light when luciferin is added. (D) Affinity purification. Protein complexes can be purified from cellular lysates using an affinity epitope, as in (C) with a FLAG tag. Components of the complex can then be identified using mass spectrometry, using the unique mass of peptides when the protein is digested by trypsin.
FIGURE 2
FIGURE 2
Phage T7: genome, virion, and interactome. ORFeome and protein interaction map of bacteriophage T7. Cloned open reading frames (ORFs) and random fragments were used to generate a two-dimensional interaction map. ORFeomes can also be used by structural genomics projects to derive three-dimensional structures. A combination of interaction maps and crystal structures often allows reconstruction of protein complexes as in viral particles or their subunits. (Top) T7 genome with each ORF represented as a box. ORFs indicated by integral numbers were identified originally as essential by genetic screens. Other genes have decimal numbers; of these, only 2.5 and 7.3 are essential. Proteins found to interact with other proteins are indicated by colored boxes; colors indicate a simplified assignment to functional classes as shown. Interactions between proteins are shown as lines, with self-interactions shown as dimers. Hatched lines indicate expected interactions that have not been found by two-hybrid analysis. Gray proteins correspond to host proteins (E. coli). Blue proteins are involved in virus assembly and structure, and, where known, their location in the virus particle is shown on the right. Proteins with thick borders have been crystallized and their structure determined. Genetic map modified after Dunn and Studier (1983). Figure modified after Uetz et al. (2004). Interactions based primarily on data in Table II (see references therein).
FIGURE 3
FIGURE 3
Genome and virion of phage λ. (A) Genome of phage λ. Colored ORFs correspond to colored proteins in (B). Main transcripts are shown as arrows. After Hendrix and Casjens in Calendar (2006). (B) Schematic model of λ virion. Numbers indicate the number of protein copies in the particle. It is unclear whether gpM and gpL proteins are in the final particle or only required for assembly. (C) Electron micrograph of phage λ. Modified after Hendrix and Casjens (2006).
FIGURE 4
FIGURE 4
Assembly of the phage λ head. Head assembly has been subdivided into five steps, although most steps are not very well understood in mechanistic terms. Note that the tail is assembled independently. GpC protease, scaffolding protein gpNu3, and portal protein gpB form an ill-defined initiator structure. Protein gpE joins this complex in a step requiring the chaperonins GroES and GroEL. Proteins gpNu1, gpA, and gpFI are required for DNA packaging. GpD joins and stabilizes the capsid as a structural protein; gpFII and gpW are connecting the head to the tail that joins once the head is completed. Modified after Georgopoulos et al. (1983) and Lander et al. (2008).
FIGURE 5
FIGURE 5
Assembly of the phage λ tail. The λ tail is made of at least six proteins (gpU, V, J, H, tfa, stf) with another seven required for assembly (gpI, M, L, K, G/T, Z). Assembly starts with protein gpJ, which then, in a poorly characterized fashion, requires proteins gpI, gpL, gpK, and gpG/T to add the tape measure protein H. GpM joins and then gpG and gpG/T leave the complex so that the main tail protein gpV can assemble on the gpJ/H scaffold. Finally, gpU is added to the head-proximal end of the tail. GpZ is required to connect the tail to the preassembled head. Protein gpH is cleaved by the action of gpU and gpZ (Tsui and Hendrix, 1983). It remains unclear if proteins gpM and gpL are part of the final particle (Hendrix and Casjens, 2006). From http://www.pitt.edu/~duda/lambdatail.html.
FIGURE 6
FIGURE 6
Interactions of phage λ with its host, E. coli. (A) Overview of λ activities in E. coli: (a) free phage, (b) binding and entry, (c) DNA circularization and supercoiling, (d) transcription, (e), replication, and (f) virion assembly. Details are shown in B–E. (B) Infection and DNA ejection, (C) DNA ligation, (D) gene regulation. An asterisk means weakly bound to the RNA polymerase. (E) DNA replication. Phage proteins are labeled in red, host proteins in black. Modified after Das (1992) and Mason and Greenblatt (1991).
FIGURE 7
FIGURE 7
Genome and virion of phage P22. (A) Genome of phage P22 with a scale in kbp below. Green open reading frames (ORFs; rectangles) are transcribed left to right; red ORFs are transcribed right to left. Known RNA polymerase promoters and transcripts are shown as black flags and arrows, respectively. (B) The asymmetric (not icosahedrally averaged) P22 virion three-dimensional cryo-EM reconstruction from Tang et al. (2011). Numbers in parentheses indicate molecules/virion, and bold numbers indicate proteins for which X-ray structures are known. (C). Negatively stained electron micrograph of P22 virions.
FIGURE 8
FIGURE 8
(A) Schematic diagram of the 33.6-kb P2 genome. Open reading frames (ORFs) are indicated by arrows that reflect their direction and size and are color coded as follow: red/orange, capsid-associated proteins (gpQ, O, N, L); blue, terminase proteins (gpP, M); yellow, lysis proteins (gpY, K, lysA, lysB); green, tail-related proteins (gpR, S, FI, FII, T, U, D); blue, base plate and tail fiber-related proteins (gpV, W, J, H, G); pink, transcriptional control proteins (Ogr, C, Cox); brown, integrase (Int); and purple, replication-related proteins (gpA,B). Nonessential genes and ORFs of unknown function are white. Promoters are indicated by arrows above ORFs. (B) Diagram of protein–protein interactions listed in Table IX. Each P2 and P4 protein is shown as a circle, colored as given earlier. Host proteins are shown as white boxes. (C) Schematic diagram of the P2 virion, color coded as given earlier. Copy numbers of proteins, when known, are indicated in parentheses. (D) Electron micrograph of a P2 virion, stained negatively with uranyl acetate.
FIGURE 9
FIGURE 9
P2 assembly. Schematic diagram of the P2/P4 capsid assembly pathway. (A) Capsid protein gpN, scaffolding protein gpO, and connector (portal) protein gpQ are assembled into the T=7 P2 procapsid. (B) GpN, gpO, and gpQ are then processed to their mature forms, N*, O*, and Q*. DNA is packaged into the procapsid by the P2 terminase complex (gpM and gpP), accompanied by expansion into the mature, angular capsid (B). (C) In the presence of the P4-encoded external scaffolding protein Sid, P2 structural proteins are assembled into a small, T=4 P4 procapsid. Loss of Sid (D), protein processing, and DNA packaging lead to the mature, expanded P4 capsid (E). The decoration protein Psu is added to the mature capsid (F).
FIGURE 10
FIGURE 10
The Dp-1 genome and interactome. (A) Dp-1 genome map. Open reading frames (ORFs) corresponding to their transcription direction are shown as arrows (genome map). Predicted transcripts and functional gene clusters are indicated. All protein–protein interactions (PPIs) identified by systematic Y2H screens among Dp-1 proteins are shown as lines that connect the corresponding ORF symbols. Proteins that bind themselves (homomers) are highlighted by gray ORF symbols. Other ORF colors: refer to Figure C-E. (B–E) A Dp-1 virion model based on identified binary PPIs, mass spectrometry analysis (MS) of mature Dp-1 virions, and homology predictions. (B) Dp-1 virion proteins, including structural proteins identified by MS analysis (in red), or proteins with a homology-based annotation that indicates a virion-related function (in black). (C) Core model of the Dp-1 virion: proteins highlighted in red were identified by MS analysis as structural components. Proteins highlighted in blue represent hypothetical gene products that interact with structural components, thus presumably playing a transient role in virion assembly as they were not identified by MS analysis of Dp-1 virions. Red edges that connect the proteins were shown to interact in Y2H tests. (D) Y2H screens do not identify all expected PPIs. Red lines represent PPIs that were expected to occur among the corresponding proteins known from homologues but were not identified in the systematic Y2H screens. (E) Systematic Y2H screens reveal unexpected PPIs. Proteins are included that were shown to bind with structural proteins and putative morphogenetic factors, e.g., DNA metabolism (DNA polymerase subunits, RecB, DNA ligase, DnaG), queuosine biosynthesis (Que proteins), lysis (Holin), and transcription (sigma factor). Interactions are symbolized by edges that connect the corresponding proteins (in the case of sigma factor gp69, interaction partners are highlighted by an asterisk). (F) Electron micrograph of a mature Dp-1 virion. C–F from Sabri et al. (2010), with permission.
FIGURE 11
FIGURE 11
Genome map and literature curated ϕ29 interactome. (A) Genome and simplified transcriptional map of ϕ29 (after Meijer et al., 2001a). Major promoters are indicated by their names, and major transcripts are shown as dashed (early) and solid (late) arrows. Other promoters are not indicated for clarity. Open reading frame (ORF) arrows indicate transcription direction. The color of ORF symbols corresponds to the color used for protein symbols in B, C, and D. PPIs known for ϕ29, organized by their cellular function (transcription, DNA replication, or virion). B. subtilis proteins are shown as rectangles, phage proteins as circles. Equal protein symbols contacting each other indicate homomers. Heteromeric PPIs are highlighted by protein symbols that are connected by lines. (D) Schematic cross view of the mature ϕ29 virion (after Xiang et al., 2008). UDG, uracil–DNA glycosylase; RNAP, RNA polymerase; TP, terminal protein.
FIGURE 12
FIGURE 12
Interactions in ϕ29 genome replication and membrane localization. Proteins that contact each other have been shown to interact. For clarity, only one genome end is shown. Parental TP is highlighted by a black symbol, whereas primer TP is in white. The upper part of the figure includes PPIs that preferentially play a role in replication initiation. The lower part of the figure indicates elongated DNA with the associated ssDNA regions. Because p16.7 and p5 (SSB) both bind ssDNA, they could either redirect the parental ssDNA strand to the membrane via TP-p16.7 and p16.7–ssDNA interactions or stabilize it in the cytoplasm via SSB alone (Meijer et al., 2001b). After Bravo et al. (2000) and Serna-Rico et al. (2003).

Similar articles

Cited by

References

    1. Abbani MA, Papagiannis CV, Sam MD, Cascio D, Johnson RC, Clubb RT. Structure of the cooperative Xis-DNA complex reveals a micronucleoprotein filament that regulates phage lambda intasome assembly. Proc Natl Acad Sci USA. 2007;104:2109–2114. - PMC - PubMed
    1. Abril AM, Marco S, Carrascosa JL, Salas M, Hermoso JM. Oligomeric structures of the phage phi29 histone-like protein p6. J Mol Biol. 1999;292:581–588. - PubMed
    1. Agarwal M, Arthur M, Arbeit RD, Goldstein R. Regulation of icosahedral virion capsid size by the in vivo activity of a cloned gene product. Proc Natl Acad Sci USA. 1990;87:2428–2432. - PMC - PubMed
    1. Agirrezabala X, Martin-Benito J, Caston JR, Miranda R, Valpuesta JM, Carrascosa JL. Maturation of phage T7 involves structural modification of both shell and inner core components. EMBO J. 2005a;24:3820–3829. - PMC - PubMed
    1. Agirrezabala X, Martin-Benito J, Valle M, Gonzalez JM, Valencia A, Valpuesta JM, Carrascosa JL. Structure of the connector of bacteriophage T7 at 8A resolution: Structural homologies of a basic component of a DNA translocating machinery. J Mol Biol. 2005b;347:895–902. - PubMed

Publication types

MeSH terms

LinkOut - more resources