

Identification of pulmonary fissures using a piecewise plane fitting algorithm
- PMID: 22749811
- PMCID: PMC3432180
- DOI: 10.1016/j.compmedimag.2012.06.001
Identification of pulmonary fissures using a piecewise plane fitting algorithm
Abstract
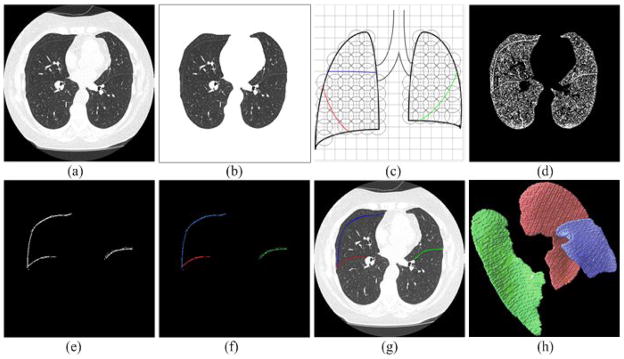
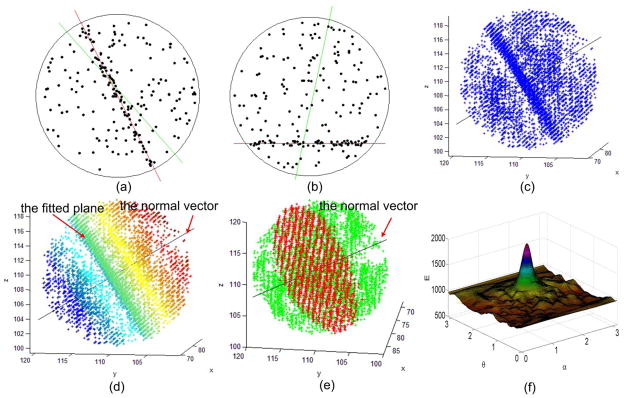
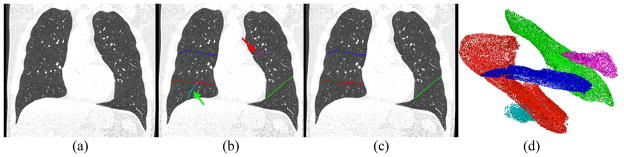
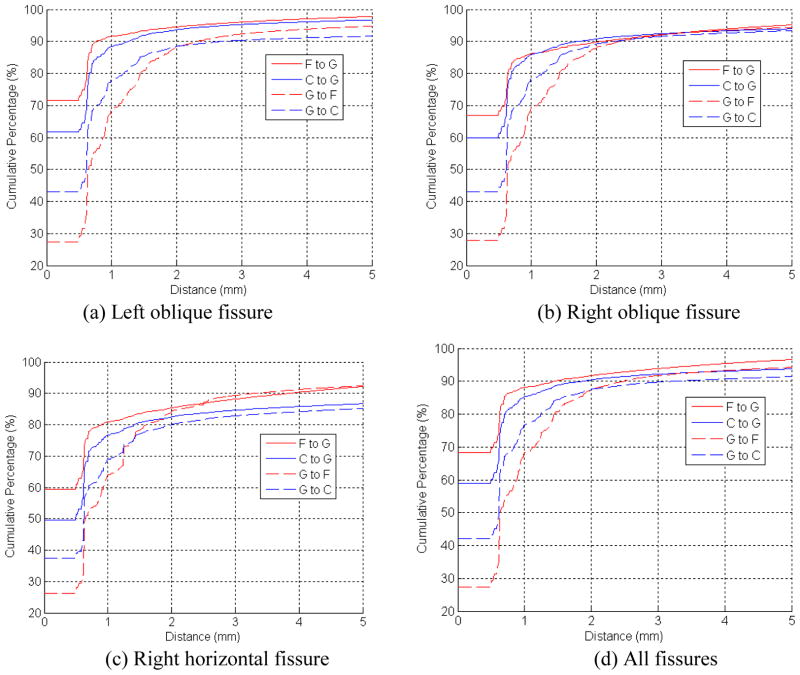
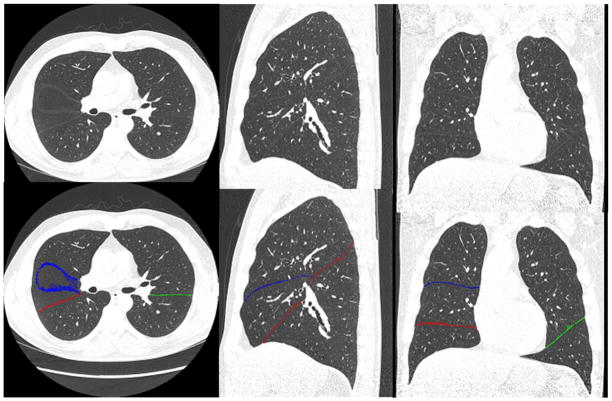
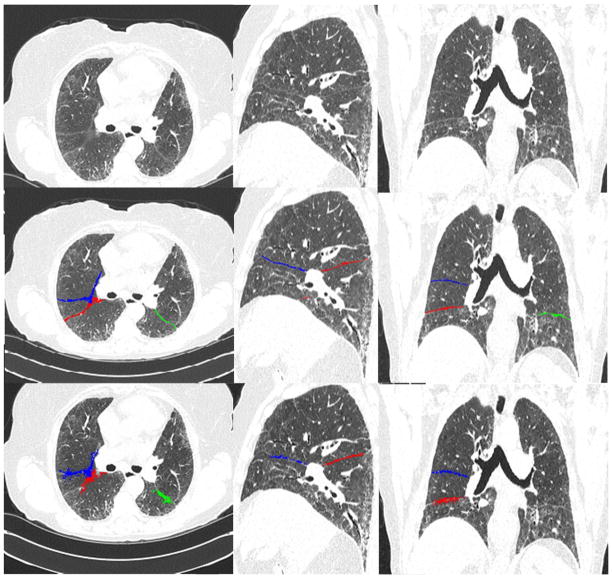
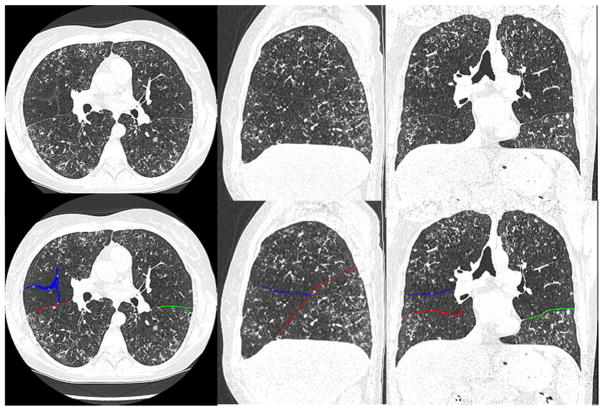
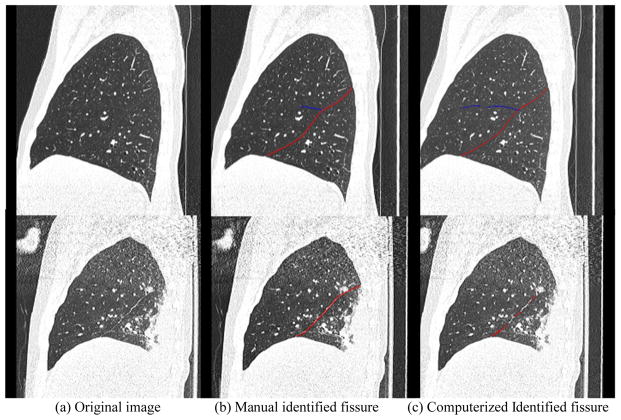
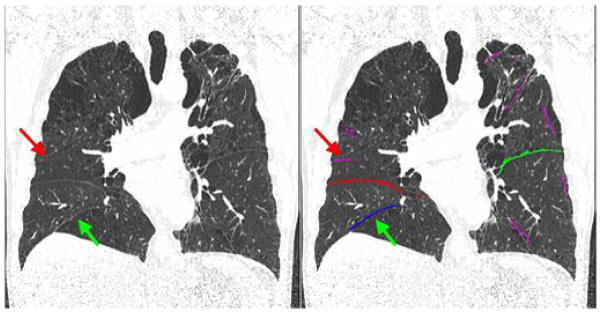
We describe an automated computerized scheme to identify pulmonary fissures depicted in chest computed tomography (CT) examinations from a novel perspective. Whereas CT images can be regarded as a cloud of points, the underlying idea is to search for surface-like structures in the three-dimensional (3D) Euclidean space by using an efficient plane fitting algorithm. The proposed plane fitting operation is performed in a number of small spherical lung sub-volumes to detect small planar patches. Using a simple clustering criterion based on their spatial coherence and surface area, the identified planar patches, assumed to represent fissures, are classified into different types of fissures, namely left oblique, right oblique and right horizontal fissures. The performance of the developed scheme was assessed by comparing with a manually created "reference standard" and the results obtained by a previously developed approach on a dataset of 30 lung CT examinations. The experiments show that the average discrepancy is around 1.0mm in comparison with the reference standard, while the corresponding maximum discrepancy is 20.5mm. In addition, 94% of the fissure voxels identified by the computerized scheme are within 3mm of the fissures in the reference standard. As compared to a previously developed approach, we also found that the newly developed scheme had a smaller discrepancy with the standard reference. In efficiency, it takes approximately 8 min to identify the fissures in a chest CT examination on a typical PC. The developed scheme demonstrates a reasonable performance in terms of accuracy, robustness, and computational efficiency.
Copyright © 2012 Elsevier Ltd. All rights reserved.
Figures
Similar articles
-
A Computational geometry approach to automated pulmonary fissure segmentation in CT examinations.IEEE Trans Med Imaging. 2009 May;28(5):710-9. doi: 10.1109/TMI.2008.2010441. Epub 2008 Dec 9. IEEE Trans Med Imaging. 2009. PMID: 19272987 Free PMC article.
-
Computerized identification of airway wall in CT examinations using a 3D active surface evolution approach.Med Image Anal. 2013 Apr;17(3):283-96. doi: 10.1016/j.media.2012.11.003. Epub 2012 Nov 29. Med Image Anal. 2013. PMID: 23260997 Free PMC article.
-
Pulmonary lobe segmentation in CT examinations using implicit surface fitting.IEEE Trans Med Imaging. 2009 Dec;28(12):1986-96. doi: 10.1109/TMI.2009.2027117. Epub 2009 Jul 21. IEEE Trans Med Imaging. 2009. PMID: 19628453 Free PMC article.
-
Computer analysis of computed tomography scans of the lung: a survey.IEEE Trans Med Imaging. 2006 Apr;25(4):385-405. doi: 10.1109/TMI.2005.862753. IEEE Trans Med Imaging. 2006. PMID: 16608056 Review.
-
Accessory and Incomplete Lung Fissures: Clinical and Histopathologic Implications.J Thorac Imaging. 2021 Jul 1;36(4):197-207. doi: 10.1097/RTI.0000000000000558. J Thorac Imaging. 2021. PMID: 33075007 Review.
Cited by
-
An Efficient Method for the Detection of Oblique Fissures from Computed Tomography images of Lungs.J Med Syst. 2019 Jun 28;43(8):252. doi: 10.1007/s10916-019-1396-0. J Med Syst. 2019. PMID: 31254114
-
Automatic segmentation of pulmonary fissures in computed tomography images using 3D surface features.J Digit Imaging. 2014 Feb;27(1):58-67. doi: 10.1007/s10278-013-9632-5. J Digit Imaging. 2014. PMID: 23982119 Free PMC article.
-
Quantifying lung fissure integrity using a three-dimensional patch-based convolutional neural network on CT images for emphysema treatment planning.J Med Imaging (Bellingham). 2024 May;11(3):034502. doi: 10.1117/1.JMI.11.3.034502. Epub 2024 May 29. J Med Imaging (Bellingham). 2024. PMID: 38817711 Free PMC article.
References
-
- Matsuo K, Iwano S, Okada T, Koike W, Naganawa S. 3D-CT Lung Volumetry Using Multidetector Row Computed Tomography: Pulmonary Function of Each Anatomic Lobe. J Thorac Imaging. 2012;27(3):164–170. - PubMed
-
- Mahmut M, Nishitani H. Evaluation of pulmonary lobe variations using multi-detector row computed tomography. Journal of Computer Assisted Tomography. 2007;31(6):956–960. - PubMed
-
- Macklem PT. Collateral ventilation. New England Journal of Medicine. 1978;298:49–50. - PubMed
-
- Hayashi K, Aziz A, Ashizawa K, Hayashi H, Nagaoki K, Otsuji H. Radiographic and CT appearances of the major fissures. Radiographics. 2001;21:861–874. - PubMed
-
- Berkmen YM, Auh YH, Davis SD, Kazam E. Anatomy of the minor fissure: evaluation with thin-section CT. Radiology. 1989;170:647–651. - PubMed
Publication types
MeSH terms
Grants and funding
LinkOut - more resources
Full Text Sources
Research Materials
