Review
. 2012 Jul;57(3):280-96.
doi: 10.1016/j.ymeth.2012.06.009. Epub 2012 Jun 26.

Photoacoustic flow cytometry

Affiliations
Review

Photoacoustic flow cytometry

Ekaterina I Galanzha et al. Methods. 2012 Jul.

Abstract

Conventional flow cytometry using scattering and fluorescent detection methods has been a fundamental tool of biological discoveries for many years. Invasive extraction of cells from a living organism, however, may lead to changes in cell properties and prevents the long-term study of cells in their native environment. Here, we summarize recent advances of new generation flow cytometry for in vivo noninvasive label-free or targeted detection of cells in blood, lymph, bone, cerebral and plant vasculatures using photoacoustic (PA) detection techniques, multispectral high-pulse-repetition-rate lasers, tunable ultrasharp (up to 0.8 nm) rainbow plasmonic nanoprobes, positive and negative PA contrasts, in vivo magnetic enrichment, time-of-flight cell velocity measurement, PA spectral analysis, and integration of PA, photothermal (PT), fluorescent, and Raman methods. Unique applications of this tool are reviewed with a focus on ultrasensitive detection of normal blood cells at different functional states (e.g., apoptotic and necrotic) and rare abnormal cells including circulating tumor cells (CTCs), cancer stem cells, pathogens, clots, sickle cells as well as pharmokinetics of nanoparticles, dyes, microbubbles and drug nanocarriers. Using this tool we discovered that palpation, biopsy, or surgery can enhance CTC release from primary tumors, increasing the risk of metastasis. The novel fluctuation flow cytometry provided the opportunity for the dynamic study of blood rheology including red blood cell aggregation and clot formation in different medical conditions (e.g., blood disorders, cancer, or surgery). Theranostics, as a combination of PA diagnosis and PT nanobubble-amplified multiplex therapy, was used for eradication of CTCs, purging of infected blood, and thrombolysis of clots using PA guidance to control therapy efficiency. In vivo flow cytometry using a portable fiber-based devices can provide a breakthrough platform for early diagnosis of cancer, infection and cardiovascular disorders with a potential to inhibit, if not prevent, metastasis, sepsis, and strokes or heart attack by well-timed personalized therapy.


Figures

Fig. 1
Fig. 1
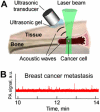
In vivo integrated PA and fluorescence flow cytometry. (A) Schematic for simultaneous detection of circulating cells (e.g., CTCs) with both absorption and fluorescence properties (right) during diagnostic and therapeutic interventions (left). (B) Example of a PA signal trace produced by melanoma CTCs (B16F10-GFP) in microvessels of the mouse ear before, during, and after pressure (120 g) applied on ~5 mm skin tumor. This figure is from a paper Mazen et al. [72].
Fig. 2
Fig. 2
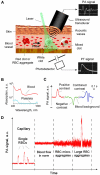
The principles of fluctuation positive and negative contrast PA flow cytometry. (A) Schematic. (B) Absorption spectra of whole blood (red) and platelet-rich plasma (blue). (C) Example of PA positive, negative, and combined contrasts from circulating clots of different compositions. (D) PA signal trace dynamics obtained with PA fluctuation flow cytometry in different vessels in normal and pathological conditions leading to RBC aggregation.
Fig. 3
Fig. 3
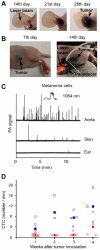
In vivo label-free, PA detection of melanoma CTCs. Melanoma tumor growth in the mouse ear (A) and skin (B). (C) Average melanoma CTC rates in the ear and abdominal skin vessels, as well as the aorta, in B16F10 tumor-bearing nude mice 1 week after tumor development. (D) Change in the CTC count in the vessels of the abdominal skin as a function of time after B16F10 tumor cell inoculation in the ear (red empty circle) and skin (blue empty square). The dark red circle and blue square indicate averaged data. Laser parameters: wavelength: 904 nm; pulse energy fluence: 100 mJ/cm2; pulse rate: 10 kHz).
Fig. 4
Fig. 4
CTC count as a marker of therapy efficacy. (A) Effect of incisional biopsy and complete resection on CTC dynamics. (B) PA guidance of PT therapy of CTCs.
Fig. 5
Fig. 5
In vivo magnetic enrichment and two-color PA detection of breast CTCs. (A) Schematic of setup. The laser beam is delivered either close to the external magnet or through a hole in the magnet using a fiber-based delivery system. (B) Schematic (left) and transmission electron microscopy image (right) of MNPs, each with a 10-nm core, a thin (2 nm) layer of amphiphilic triblock copolymers modified with short polyethylene glycol (PEG) chains and the amino-terminal fragment (ATF) of the urokinase plasminogen activator. Scale bar, 10 nm. (C) Schematic (left) and topographic atomic force microscopy image (right) of a GNT (12 × 98 nm) coated with PEG and folic acid. (D) PA spectra of 70-μm veins in the mouse ear (open circles). Absorption spectra of magnetic nanoparticles (MNPs) and GNTs (dashed red and green curves) are normalized to PA signals from CTCs labeled with MNPs (filled red circle) and GNTs (filled green circle).
Fig. 6
Fig. 6
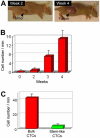
PA detection of bulk and stem-like breast CTCs in tumor-bearing mice. (A) The size of the primary breast cancer xenografts at different stages of tumor development. (B) The average rate of bulk CTCs in the mouse ear vein over a period of 1–4 weeks. (C) Average rate of CTCs associated with bulk Folate+/uPAR + CTCs and Folate-CD44 + stem-like CTCs in 200 μm in abdominal skin blood vessels in the mouse model of breast tumor (at week 4).
Fig. 7
Fig. 7
PA scanning cytometry of melanoma metastasis in the sentinel lymph node (1.6 × 3 mm) at a single cancer cell level using the tumor-bearing mouse model at weeks one (left) and two (right) of tumor development. Red pseudo-color peaks indicate PA signals with maximum amplitudes. Each single spot is associated with single metastatic cells.
Fig. 8
Fig. 8
PA molecular diagnosis and photothermal-targeted eradication of circulating S. aureus in the blood of the mouse model with real-time PA monitoring of PT nanotherapeutic efficacy. (A) Schematic. (B) Experimental data. This figure is from a paper Galanzha et al. [73].
Fig. 9
Fig. 9
Label-free, real-time, PA detection of white, red, and mixed clots in the ear vessel of the mouse model in various disease states. (A) Monitoring of clots in the myocardial infarction animal model at a laser wavelength of 532 nm. The laser pulse repetition rate is 10 kHz. (B) Detection of clot formation in the blood vessels of the melanoma-bearing mouse model (at week 4). (C) Monitoring of clot formation during and after surgery modeled by small skin incision.
Fig. 10
Fig. 10
Average PT signal amplitudes from normal and sickle RBCs of different shapes at a laser wavelength of 532 nm.
Fig. 11
Fig. 11
In vivo PA bone flow cytometry. (A) Schematics. (B) Noninvasive in vivo molecular targeted detection of breast CTCs in mouse tibia.
Fig. 12
Fig. 12
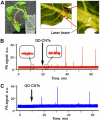
In vivo PA plant flow cytometry of QD–CNTs in tomato vasculature. (A) Linear laser spot in a leaf mid-vein, close to petiole. The red lines denote the part of the plant used for monitoring. (B) The trace of PA signals recorded in the leaf mid-vein after QD–CNTs were introduced into the water tank. Insets demonstrate the enlarged parts of the control trace and the trace fragment with signals from QD–CNTs. (C) The trace of PA signals from QD–CNTs recorded in the stem of the tomato plant. Black arrows indicate the moment QD–CNTs were introduced into the water tank. The PA traces before the introduction of QD–CNTs represent control data. Laser parameters: wavelength: 1064 nm; pulse width: 10 ns; pulse repetition rate: 10 kHz; laser pulse energy: 20 μJ; laser spot size in sample: 50 × 150 μm (B) and 100 × 400 μm (C).
Fig. 13
Fig. 13
In vivo PA time-of-flight velocity measurements of cells and nanoparticles. (A) Shapes of peaks in PA trace for particles of different sizes and various beam geometries. (B) Peak widths distributions in the WBCs in the mouse circulatory system targeted by GNRs with antibodies specific for the CD45 receptor. Laser parameters: wavelength: 820 nm, pulse width, 8 ns; pulse repetition rate: 10 kHz; laser pulse energy: 20 μJ. (C) Scatter plot of the height and width of peaks for label-free PA detection of circulating B16F10 cells in an arteriole of the mouse ear. Area I indicates signals from individual cells. Area II includes aggregates of several cells, and Area III indicates possible “rolling” cells.
Fig. 14
Fig. 14
PA monitoring of NP and cell clearance rates. (A) In vivo PA signal levels from the mouse ear vein and surrounding skin, compared to baseline noise, when the laser is off (top). Laser parameters: wavelength: 820 nm; fluence, 0.2 J/cm2; pulse rate: 10 kHz. PA monitoring of the clearance rate of 30-nm spherical gold NPs in a blood vessel of the mouse ear (middle). Laser parameters: 532 nm/cm2, 9 kHz. PA monitoring of GNR clearance in a blood vessel of the mouse ear (bottom). Laser parameters: 1064 nm, 0.1 J/cm2, 9 kHz. (B) PA monitoring of the clearance rates of melanoma cells at different functional states and metastatic activity and normal blood cells labeled with contrast dyes.
Fig. 15
Fig. 15
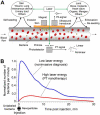
Ultrasharp nonlinear PA and PT spectral resonances. (A) Ultra-narrow resonances and dips in a homogenous absorption profile. (B) Asymmetric (~0.8 nm in width) resonance in GNRs. (C) Absorption and nonlinear PT spectra of a mixture of 30 nm gold nanospheres and six gold nanorods with spectrally different Plasmon resonances.
Fig. 16
Fig. 16
Positive and negative contrasts in PA and fluorescence flow cytometry. (A) Negative PA, and positive fluorescent contrast signals from circulating C8161-GFP cells in 40-μm ear artery of the mouse. (B) In vivo fluorescent monitoring of white and red clots with positive and negative contrast, respectively. Laser excitation wavelength: 488 nm; intensity: 80 W/cm2.

References

    1. Shapiro HM. Practical Flow Cytometry. fourth ed. Wiley-Liss; New York: 2003.
    1. Sack U, Tárnok A, Rothe G, editors. Cellular Diagnostics: Basic Principles, Methods and Clinical Applications of Flow Cytometry. Karger; Basel, Freiburg, Paris: 2008.
    1. Tuchin VV, Tarnok A, Zharov VP. Cytometry A. 2011;79A:737–745. - PMC - PubMed
    1. Zharov VP, Galanzha EI, Tuchin VV. Proc. SPIE. 2004;5320:256–263.
    1. Galanzha EI, Tuchin VV, Chowdhury P, Zharov VP. Proc. SPIE. 2004;5474:204–214.

Publication types