. 2012 Oct;237(2):318-34.
doi: 10.1016/j.expneurol.2012.06.025. Epub 2012 Jun 27.

Regionally-specific microglial activation in young mice over-expressing human wildtype alpha-synuclein

Affiliations

Regionally-specific microglial activation in young mice over-expressing human wildtype alpha-synuclein

Melanie B Watson et al. Exp Neurol. 2012 Oct.

Abstract

Parkinson's disease (PD) is characterized by widespread alpha-synuclein pathology and neuronal loss, primarily of the nigrostriatal dopaminergic neurons. Inflammation has been implicated in PD, and alpha-synuclein can initiate microglial activation; however, the kinetics and distribution of inflammatory responses to alpha-synuclein overexpression in vivo are not well understood. We have examined the regional and temporal pattern of microglial activation and pro-inflammatory cytokine production in mice over-expressing wild-type human alpha-synuclein driven by the Thy1-promoter (Thy1-aSyn mice). An increased number of activated microglia, and increased levels of TNF-α mRNA and protein were first detected in the striatum (1 month of age) and later in the substantia nigra (5-6 months), but not the cerebral cortex or cerebellum; in contrast, IL-1β and TGF-β remained unchanged in the striatum and substantia nigra at all ages examined. Microglial activation persisted up to 14 months of age in these regions and only minimal increases were observed in other regions at this later age. Increased concentrations of serum TNF-α were observed at 5-6 months, but not at 1 month of age. The expression of toll-like receptors (TLRs) 1, TLR 4 and TLR 8, which are possible mediators of microglial activation, was increased at 5-6 months in the substantia nigra but not in the cerebral cortex, and TLR 2 was increased in the substantia nigra at 14 months of age. With the exception of a slight increase in the striatum of 14 month old Thy1-aSyn mice, MHCII staining was not detected in the regions and ages examined. Similarly, peripheral CD4 and CD8-postive T cells were increased in the blood but only at 22 months of age, suggesting later involvement of the adaptive immune response. These data indicate that, despite the presence of high levels of alpha-synuclein in other brain regions, alpha-synuclein overexpression caused a selective early inflammatory response in regions containing the axon terminals and cell bodies of the nigrostriatal pathway. Our results suggest that specific factors, possibly involving a regionally and temporally selective increase in TLRs, mediate alpha-synuclein-induced inflammatory responses in the SN, and may play a role in the selective vulnerability of nigrostriatal dopaminergic neurons in PD.


Figures

Fig. 1
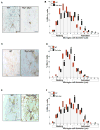
Fig. 1. Microglial activation in the striatum of Thy1a-Syn mice
(A) Representative images of IBA-1+ microglia in striatum of 1 month, (C) 5–6 month and (E) 14 month old WT and Thy1-aSyn mice (100x, scale bar 20μm). Diameter of IBA-1+ microglial cells measured in two sections of the striatum at 1 month (WT n=5–6, Thy1-aSyn n=5–6), 5–6 months (WT n=4–6, Thy1-aSyn n=4–6) and 14 months (WT n=3, Thy1-aSyn n=3) of age. Significance is represented if black confidence intervals (Thy1-aSyn) fall outside of 95% confidence interval (red segment of bar means for WT mice), calculated by bootstrapping (*p<0.05). (B) Significant decrease in resting and significant increase in activated IBA-1+ microglial cells in striatum of 1 month old Thy1-aSyn compared with WT mice. (D) In comparison to WT mice, Thy1-aSyn mice displayed a significant decrease in resting and significant increase in activated IBA-1+ microglial cells in the striatum at 5–6 months of age. (F) There was a significant decrease in resting and significant increase in activated IBA-1+ microglial cells in striatum of 14 month old Thy1-aSyn mice. No such changes were observed in the striatum of 14 month old WT mice. Values are mean ± 95%CI.
Fig. 2
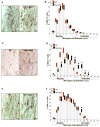
Fig. 2. Microglial activation in the substantia nigra of Thy1a-Syn mice
(A) Representative images of IBA-1+ microglia in SN of 1 month, (C) 5–6 month and (E) 14 month old WT and Thy1-aSyn mice (100x, scale bar 20μm). Diameter of IBA-1+ microglial cells measured in two sections of the SN at 1 month (WT n=4, Thy1-aSyn n=4) and 14 months (WT n=3, Thy1-aSyn n=3) and in one section at 5–6 months (WT n=6, Thy1-aSyn n=6) of age. Significance is represented if black confidence intervals (Thy1-aSyn) fall outside of 95% confidence interval (red segment of bar means for WT mice), calculated by bootstrapping (*p<0.05). (B) Similar levels of resting and activated IBA-1+ microglial cells in SN of 1 month old WT and Thy1a-Syn mice. (D). Resting IBA-1+ microglia were decreased and activated IBA-1+ microglia were increased in SN of 5–6 month old Thy1-aSyn mice, this effect was not observed in WT mice. (F) In contrast to WT mice, activated IBA-1+ microglial cells were persistently increased in SN of 14 month old Thy1-aSyn mice. Values are mean ± 95%CI
Fig. 3
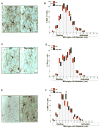
Fig. 3. Microglial phenotype is similar in the cerebral cortex of Thy1a-Syn mice
(A) Representative images of IBA-1+ microglia in cerebral cortex of 1 month, (C) 5–6 month and (E) 14 month old WT and Thy1-aSyn mice (100x, scale bar 20μm). Diameter of IBA-1+ microglial cells measured in two sections of the cerebral cortex at 1 month (WT n=4, Thy1-aSyn n=4), 5–6 months (WT n=6, Thy1-aSyn n=6), and 14 months (WT n=3, Thy1-aSyn n=3) of age. Significance is represented if black confidence intervals (Thy1-aSyn) fall outside of 95% confidence interval (red segment of bar means for WT mice), calculated by bootstrapping (*p<0.05). (B) Compared with WT mice, Thy1-aSyn mice had a significant reduction in the percentages of hyperramified microglial cells in the cerebral cortex at 1 month of age. (D) WT and Thy1-aSyn mice had similar levels of resting and activated IBA-1+ microglial cells in cerebral cortex at 5–6 months of age. (F) At 14 months of age, there was a significant increase in the percentages of hyperramified microglial cells in the cerebral cortex of Thy1-aSyn mice compared with WT mice. Values are mean ± 95%CI.
Fig. 4
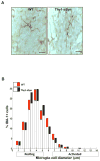
Fig. 4. Microglial phenotype is similar in the cerebellum of Thy1a-Syn mice
(A) Representative images of IBA-1+ microglia in the cerebellum of 5–6 month old WT and Thy1-aSyn mice. Diameter of IBA-1+ microglial cells measured in two sections of the cerebellum at 5–6 months of age (WT n=6, Thy1-aSyn n=6, 100x, scale bar 20μm). Significance is represented if black confidence intervals (Thy1-aSyn) fall outside of 95% confidence interval (red segment of bar means for WT mice), calculated by bootstrapping (*p<0.05). (B) Similar levels of resting and activated IBA-1+ microglial cells in the cerebellum of 5–6 month old WT and Thy1a-Syn mice. Values are mean ± 95%CI
Fig. 5
Fig. 5. MHCII-positive microglia are increased in the striatum of 14 month old Thy1-aSyn mice
MHCII-positive (MHCII+) microglia were examined using antibodies against Ox-6. Representative images from WT and Thy1-aSyn mice at 14 months of age show increased MHCII+ microglia in striatum of Thy1-aSyn mice. Solid arrows indicated MHCII+ microglia, 100x, scale bar = 20μm.
Fig. 6
Fig. 6. TNF-α protein in striatum and substantia nigra of Thy1-aSyn mice
(A) Compared to WT mice, TNF-α protein measured by ELISA was significantly increased in the striatum of 1 month old Thy1-aSyn mice (*p<0.05, RM ANOVA followed by planned comparison Student’s t test, WT n=5, Thy1-aSyn n=4). (B) Similar increases in TNF-α protein were observed in striatum of 5–6 month old Thy1-aSyn mice (*p<0.05, RM ANOVA followed by Fisher’s LSD, WT n=5, Thy1-aSyn n=6). (C) Increases in TNF-α protein were also observed in the SN of 5–6 month old Thy1-aSyn mice compared with WT mice (*p<0.05, Student’s t test, WT n=4, Thy1-aSyn n=4). Values are mean ± SEM.
Fig. 7
Fig. 7. Alpha-synuclein levels across different brain regions in Thy1-aSyn mice
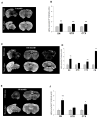
Alpha-synuclein is broadly over-expressed in the brain of Thy1-aSyn mice. (A) Representative images of alpha-synuclein immunofluorescence in the striatum, SN and cerebral cortex of 1 month old WT and Thy1-aSyn mice. (B) Alpha synuclein immunofluorescent intensity is increased in the striatum, SN and cerebral cortex of 1 month old Thy1-aSyn mice compared with WT mice. (C) Representative images of alpha-synuclein immunofluorescence in the striatum, SN, cerebral cortex and cerebellum of 5–6 month old WT and Thy1-aSyn mice (D) Compared with WT mice alpha synuclein immunofluorescent intensity is increased in the SN, cerebral cortex and cerebellum of 5–6 month old Thy1-aSyn mice (E) Representative images of alpha-synuclein immunofluorescence in the striatum, SN and cerebral cortex 14 month old WT and Thy1-aSyn mice (F) Compared with WT mice alpha synuclein immunofluorescent intensity is increased in the SN and cerebral cortex of 14 month old Thy1-aSyn mice. (n=4–6, values are expressed as the mean +SEM pixel intensity for each region, RM ANOVA followed by Fisher’s LSD).
Fig 8
Fig 8. TLR 1, TLR 2, TLR 4 and TLR 8 mRNA expression in the substantia nigra and cerebral cortex of Thy1-aSyn mice
The mRNA expression of TLR 1, TLR 2, TLR 4 and TLR 8 were measured by Q-PCR using SyberGreenER chemistry in the SN of 1 month (WT n=6, Thy1-aSyn n=6), 5–6 month (WT n=4, Thy1-aSyn n=4) and 14 month (WT n=13, Thy1-aSyn n=7) old mice and in the cerebral cortex of 5–6 month (WT n=4, Thy1-aSyn n=4) old mice. (A) We observed a significant decrease in the expression of TLR 1 mRNA in the SN of 1 month old Thy1-aSyn mice (*p<0.05, RM ANOVA followed by Fisher’s LSD). (B) The expression of TLR 1 and TLR 8 were significantly increased (*p<0.05, **p<0.01, RM ANOVA followed by Fisher’s LSD) in the SN and the expression of TLR 4 was also increased (*p<0.05; Student’s t test) in the SN of 5–6 month old Thy1-aSyn mice. (C) However, the expression of TLR 1, 4 and 8 was similar in the cerebral cortex of 5–6 month old WT and Thy1-aSyn mice. (D) Compared with WT mice, the expression of TLR 2 was significantly increased in SN of 14 month old Thy1-aSyn mice (*p<0.05; RM ANOVA followed by Fisher’s LSD). Values are mean ± SEM
Fig. 9
Fig. 9. Timeline of microglial activation and TNF-α in Thy1-aSyn mice
Figure depicts the timeline of microglial activation; TNF-α production and TLR expression described in this manuscript in relation to other previously published phenotypic markers in the Thy1-aSyn mice (Lam et al., 2011, Chesselet and Richter, 2011). At 1 month of age, there is increased microglial activation and TNF-α expression in the striatum of Thy1-aSyn mice. By 5–6 months of age, increased microglial activation, TNF-α production occurs in both the striatum and substantia nigra and increased expression of TLR 1, 4 and 8 in the substantia nigra of Thy1-aSyn mice. These changes coincide with increased extracellular dopamine in the striatum of Thy1-aSyn mice and hyperactivity in the open field test (Lam et al., 2011). At 14 months of age, microglial activation is sustained in the striatum and substantia nigra with increased TNF-α expression and TLR 2 expression in the substantia nigra. This is accompanied by a reduction in tissue dopamine content, terminal loss and parkinsonian motor deficits (Lam et al., 2011). No increases in microglial activation or TNF-α expression were observed in the cerebral cortex at any age (open circles indicate no change).

Similar articles

Cited by

References

    1. Alvarez-Erviti L, Couch Y, Richardson J, Cooper JM, Wood MJ. Alpha-synuclein release by neurons activates the inflammatory response in a microglial cell line. J Neurosci Res. 2011;69:337–342. - PubMed
    1. Appel SH, Beers DR, Henkel JS. T cell-microglial dialogue in Parkinson’s disease and amyotrophic lateral sclerosis, are we listening? Trends Immunol. 2010;31:7–17. - PMC - PubMed
    1. Baba Y, Kuroiwa A, Uitti RJ, Wszolek ZK, Yamada T. Alterations of T-lymphocyte populations in Parkinson disease. Parkinsonism Relat Disord. 2005;11:493–498. - PubMed
    1. Bartels AL, Leenders KL. Neuroinflammation in the pathophysiology of Parkinson’s disease: evidence from animal models to human in vivo studies with [11C]-PK11195 PET. Mov Disord. 2007;22:1852–1856. - PubMed
    1. Batchelor PE, Liberatore GT, Wong JY, Porritt MJ, Frerichs F, Donnan GA, Howells DW. Activated macrophages and microglia induce dopaminergic sprouting in the injured striatum and express brain-derived neurotrophic factor and glial cell line-derived neurotrophic factor. J Neurosci. 1999;19:1708–1716. - PMC - PubMed

Publication types

MeSH terms