

Nascent high density lipoproteins formed by ABCA1 resemble lipid rafts and are structurally organized by three apoA-I monomers
- PMID: 22750655
- PMCID: PMC3413229
- DOI: 10.1194/jlr.M026674
Nascent high density lipoproteins formed by ABCA1 resemble lipid rafts and are structurally organized by three apoA-I monomers
Abstract
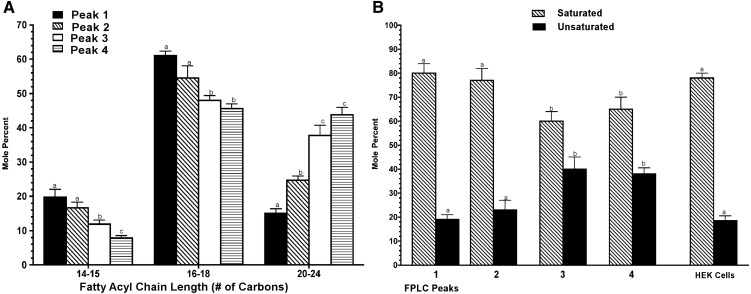
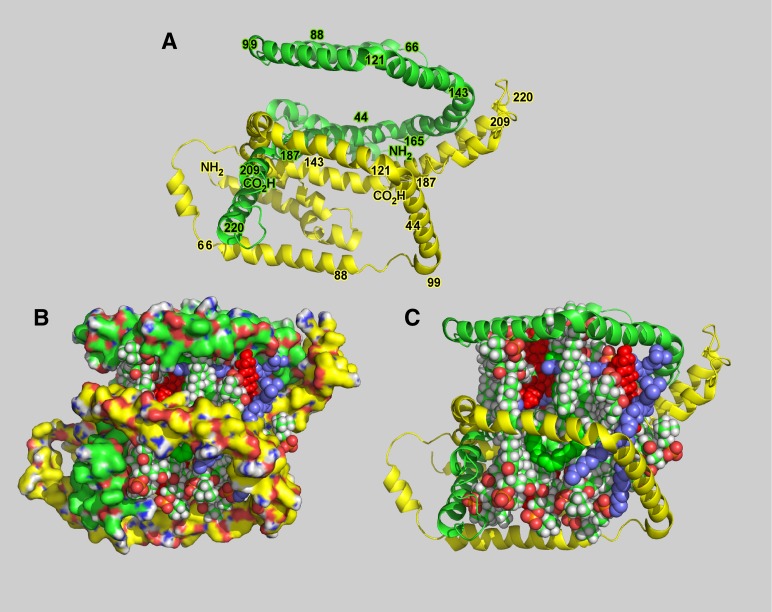
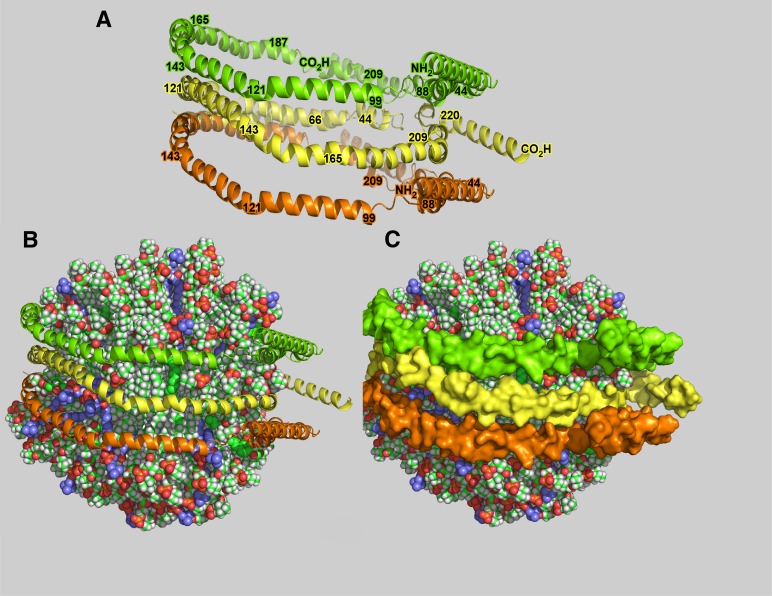
This report details the lipid composition of nascent HDL (nHDL) particles formed by the action of the ATP binding cassette transporter A1 (ABCA1) on apolipoprotein A-I (apoA-I). nHDL particles of different size (average diameters of ∼ 12, 10, 7.5, and <6 nm) and composition were purified by size-exclusion chromatography. Electron microscopy suggested that the nHDL were mostly spheroidal. The proportions of the principal nHDL lipids, free cholesterol, glycerophosphocholine, and sphingomyelin were similar to that of lipid rafts, suggesting that the lipid originated from a raft-like region of the cell. Smaller amounts of glucosylceramides, cholesteryl esters, and other glycerophospholipid classes were also present. The largest particles, ∼ 12 nm and 10 nm diameter, contained ∼ 43% free cholesterol, 2-3% cholesteryl ester, and three apoA-I molecules. Using chemical cross-linking chemistry combined with mass spectrometry, we found that three molecules of apoA-I in the ∼ 9-14 nm nHDL adopted a belt-like conformation. The smaller (7.5 nm diameter) spheroidal nHDL particles carried 30% free cholesterol and two molecules of apoA-I in a twisted, antiparallel, double-belt conformation. Overall, these new data offer fresh insights into the biogenesis and structural constraints involved in forming nascent HDL from ABCA1.
Figures


Similar articles
-
Effects of apolipoprotein A-I on ATP-binding cassette transporter A1-mediated efflux of macrophage phospholipid and cholesterol: formation of nascent high density lipoprotein particles.J Biol Chem. 2003 Oct 31;278(44):42976-84. doi: 10.1074/jbc.M308420200. Epub 2003 Aug 19. J Biol Chem. 2003. PMID: 12928428
-
Molecular and cellular physiology of apolipoprotein A-I lipidation by the ATP-binding cassette transporter A1 (ABCA1).J Biol Chem. 2004 Feb 27;279(9):7384-94. doi: 10.1074/jbc.M306963200. Epub 2003 Dec 4. J Biol Chem. 2004. PMID: 14660648
-
Influence of apolipoprotein (Apo) A-I structure on nascent high density lipoprotein (HDL) particle size distribution.J Biol Chem. 2010 Oct 15;285(42):31965-73. doi: 10.1074/jbc.M110.126292. Epub 2010 Aug 2. J Biol Chem. 2010. PMID: 20679346 Free PMC article.
-
ATP-binding cassette transporter AI and its role in HDL formation.Curr Opin Lipidol. 2005 Feb;16(1):19-25. doi: 10.1097/00041433-200502000-00005. Curr Opin Lipidol. 2005. PMID: 15650559 Review.
-
High density lipoprotein structure-function and role in reverse cholesterol transport.Subcell Biochem. 2010;51:183-227. doi: 10.1007/978-90-481-8622-8_7. Subcell Biochem. 2010. PMID: 20213545 Free PMC article. Review.
Cited by
-
The ins and outs of lipid rafts: functions in intracellular cholesterol homeostasis, microparticles, and cell membranes: Thematic Review Series: Biology of Lipid Rafts.J Lipid Res. 2020 May;61(5):676-686. doi: 10.1194/jlr.TR119000383. Epub 2020 Nov 7. J Lipid Res. 2020. PMID: 33715815 Free PMC article. Review.
-
New insights into the determination of HDL structure by apolipoproteins: Thematic review series: high density lipoprotein structure, function, and metabolism.J Lipid Res. 2013 Aug;54(8):2034-2048. doi: 10.1194/jlr.R034025. Epub 2012 Dec 10. J Lipid Res. 2013. PMID: 23230082 Free PMC article. Review.
-
Atherosclerosis: Making a U Turn.Annu Rev Med. 2020 Jan 27;71:191-201. doi: 10.1146/annurev-med-042418-011108. Annu Rev Med. 2020. PMID: 31986087 Free PMC article. Review.
-
ABCA1 and nascent HDL biogenesis.Biofactors. 2014 Nov-Dec;40(6):547-54. doi: 10.1002/biof.1187. Epub 2014 Oct 30. Biofactors. 2014. PMID: 25359426 Free PMC article. Review.
-
Mechanism of the Regulation of Plasma Cholesterol Levels by PI(4,5)P2.Adv Exp Med Biol. 2023;1422:89-119. doi: 10.1007/978-3-031-21547-6_3. Adv Exp Med Biol. 2023. PMID: 36988878
References
-
- Castelli W. P., Doyle J. T., Gordon T., Hames C. G., Hjortland M. C., Hulley S. B., Kagan A., Zukel W. J. 1977. HDL cholesterol and other lipids in coronary heart disease. The Cooperative Lipoprotein Phenotyping Study. Circulation. 55: 767–772. - PubMed
-
- Duffy D., Rader D. J. 2009. Update on strategies to increase HDL quantity and function. Nat Rev Cardiol. 6: 455–463. - PubMed
-
- Francis G. A. 2010. The complexity of HDL. Biochim. Biophys. Acta. 1801: 1286–1293. - PubMed
-
- Oram J. F., Heinecke J. W. 2005. ATP-binding cassette transporter A1: a cell cholesterol exporter that protects against cardiovascular disease. Physiol. Rev. 85: 1343–1372. - PubMed
-
- Timmins J. M., Lee J. Y., Boudyguina E., Kluckman K. D., Brunham L. R., Mulya A., Gebre A. K., Coutinho J. M., Colvin P. L., Smith T. L., et al. 2005. Targeted inactivation of hepatic Abca1 causes profound hypoalphalipoproteinemia and kidney hypercatabolism of apoA-I. J. Clin. Invest. 115: 1333–1342. - PMC - PubMed
Publication types
MeSH terms
Substances
Grants and funding
- 1S10RR027940/RR/NCRR NIH HHS/United States
- P60 DK020593/DK/NIDDK NIH HHS/United States
- DK58404/DK/NIDDK NIH HHS/United States
- P30 DK058404/DK/NIDDK NIH HHS/United States
- S10 RR027940/RR/NCRR NIH HHS/United States
- HL-49373/HL/NHLBI NIH HHS/United States
- HL-64163/HL/NHLBI NIH HHS/United States
- P30 CA012197/CA/NCI NIH HHS/United States
- R01 HL064163/HL/NHLBI NIH HHS/United States
- 5P30CA12197/CA/NCI NIH HHS/United States
- P30 DK020593/DK/NIDDK NIH HHS/United States
- S10 RR017846/RR/NCRR NIH HHS/United States
- P30 CA068485/CA/NCI NIH HHS/United States
- CA68485/CA/NCI NIH HHS/United States
- P01 HL049373/HL/NHLBI NIH HHS/United States
- DK20593/DK/NIDDK NIH HHS/United States
- HL-48148/HL/NHLBI NIH HHS/United States
LinkOut - more resources
Full Text Sources
