. 2012 Aug;14(8):859-64.
doi: 10.1038/ncb2531. Epub 2012 Jul 1.

Metabolic differentiation in the embryonic retina

Affiliations

Metabolic differentiation in the embryonic retina

Michalis Agathocleous et al. Nat Cell Biol. 2012 Aug.

Abstract

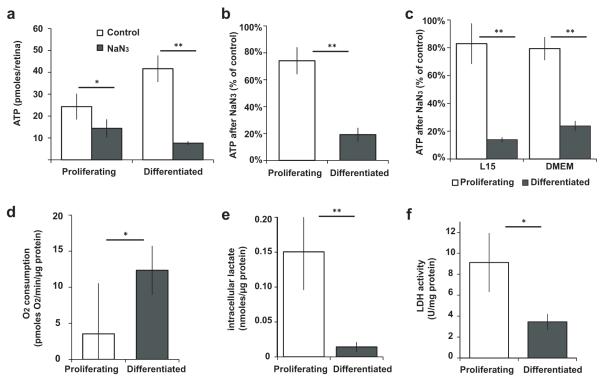
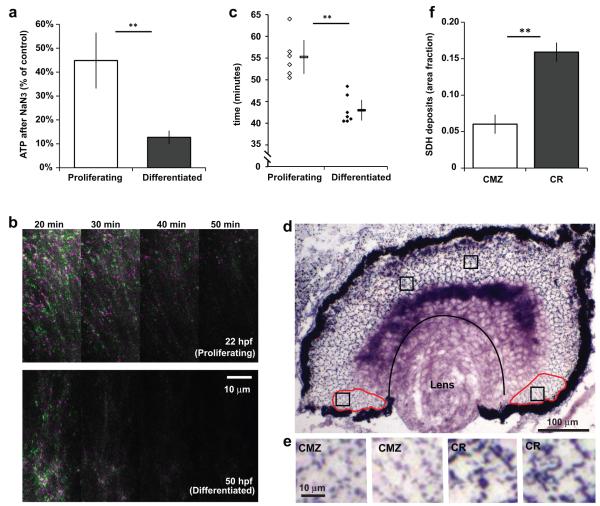
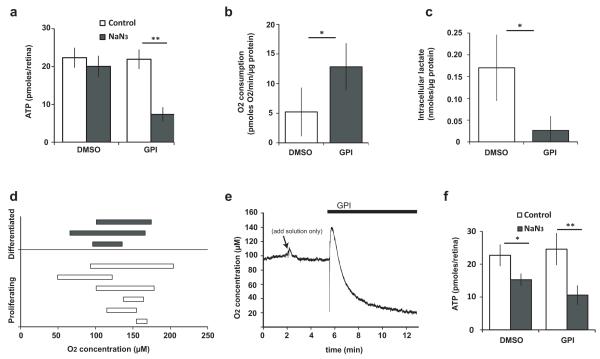
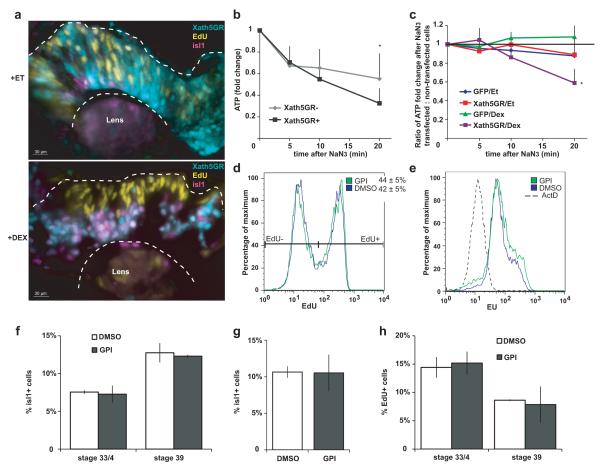
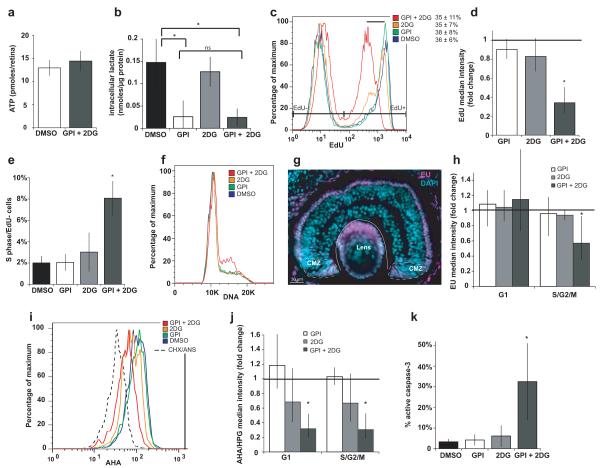
Unlike healthy adult tissues, cancers produce energy mainly by aerobic glycolysis instead of oxidative phosphorylation. This adaptation, called the Warburg effect, may be a feature of all dividing cells, both normal and cancerous, or it may be specific to cancers. It is not known whether, in a normally growing tissue during development, proliferating and postmitotic cells produce energy in fundamentally different ways. Here we show in the embryonic Xenopus retina in vivo, that dividing progenitor cells depend less on oxidative phosphorylation for ATP production than non-dividing differentiated cells, and instead use glycogen to fuel aerobic glycolysis. The transition from glycolysis to oxidative phosphorylation is connected to the cell differentiation process. Glycolysis is indispensable for progenitor proliferation and biosynthesis, even when it is not used for ATP production. These results suggest that the Warburg effect can be a feature of normal proliferation in vivo, and that the regulation of glycolysis and oxidative phosphorylation is critical for normal development.


Figures

Figure 1
Figure 1
Proliferating cells rely less than differentiated cells on oxidative phosphorylation for ATP, and have higher glycolysis. (a-c) ATP in proliferating (P) or differentiated (D) retinas after inhibition of oxidative phosphorylation with NaN3 (a) for 15 minutes in vivo, showing ATP per retina (P, n=5, p=0.03; D, n=5, p=5×10⁻⁶); (b) for 10 minutes in explants in MBS, showing % ATP compared to controls (P, n=13, p=0.002; D, n=11, p=3×10⁻⁵ compared to controls; P-D comparison, p=4×10⁻⁸); (c) in explants in L15 (P, n=5, p=0.3; D, n=5, p=0.0009 compared to controls; P-D comparison, p=4×10⁻⁷) or DMEM (P, n=4, p=0.06; D, n=5, p=5×10⁻⁷ compared to controls; P-D comparison, p=10−5). (d) Rate of oxygen consumption in fresh retinal explants in L15 (n=6, p=0.03). (e) Intracellular lactate of proliferating and differentiated retinas in vivo (P, n=5; D, n=7; p=10−4). (f) LDH activity of proliferating and differentiated retinas (n=7, p=0.003). Error bars in all figures show 95% confidence intervals; * 0.001 < p < 0.05; ** p < 0.001
Figure 2
Figure 2
Metabolic differences between progenitors and differentiated cells are also present in the postembryonic retinal stem cell niche, and in the zebrafish retina. (a) ATP levels in freshly explanted zebrafish retinas in L15 after inhibition of oxidative phosphorylation with NaN3 for 10 minutes (P, n=14, p=0.0002; D, n=15, p=4×10⁻⁸; P-D comparison, p=8×10⁻⁷). (b) EB3-GFP imaging in the zebrafish retina. Each panel is the merged image of two frames 20 seconds apart, coloured green or magenta, at the indicated time after Antimycin A. Dots that moved between frames should be green or magenta. Proliferating cells (top) keep up EB3-GFP motion for longer than differentiated cells (bottom). (c) Time taken after Antimycin A for the EB3-GFP motion to stop in differentiated 50-54 hpf retinas (n=7 movies) and proliferating 22-26 hpf retinas (n=6). Averages shown next to individual data points (p=0.0002). (d) Dark deposits as a result of SDH activity in a retinal section that includes proliferating ciliary margin zone cells (CMZ, circumscribed in red) and differentiated central retina cells (CR, region between the pigmented epithelium, lens and CMZ). (e) Magnification of the boxes in (d) showing that deposits in the CMZ are both fainter and less dense than in the CR. (f) Quantification of the area fraction covered by deposits (n=43, p<10−10).
Figure 3
Figure 3
Inhibition of glycogen breakdown shifts energy production from glycolysis to oxidative phosphorylation. (a) ATP levels in freshly explanted proliferating retinas in MBS pre-incubated with GPI for 20 minutes, followed by 10 minutes of NaN3 (DMSO, n=22, p>0.05; GPI, n=27, p=5×10⁻¹²). (b) Rate of oxygen consumption in fresh retinal explants incubated with GPI in L15 (n=9, p<0.05). (c) Intracellular lactate in retinal explants incubated for 3 hours with GPI (n=4, p=0.01). (d) Each bar represents the range of [O2] sampled from various points in the retina of a live embryo at stage 25 (proliferating) or stage 41 (differentiated). (e) Addition of GPI in the medium while recording from a specific point in the proliferating retinas lowers [O2] (4/4 experiments, decrease ranging from 8-73 μM O2, depending on the depth sampled from the surface; no decrease observed with control solutions; the momentary upward spike is a response to adding more solution). (f) Inhibition of oxidative phosphorylation with NaN3 at stage 25 in vivo reduced ATP in the retina to a greater extent in GPI treated embryos (57% drop, n=8, p=0.0004) compared to controls (33% drop, n=9, p=0.005).
Figure 4
Figure 4
Cell differentiation can affect energy metabolism, while shifting energy metabolism to oxidative phosphorylation does not influence aspects of proliferation and differentiation. (a) Activation of Xath5GR (expressed in cyan cells) by dexamethasone (bottom panel) promotes cell cycle exit, migration to the basal layer where ganglion cells normally reside, and expression of isl1, compared to non-expressing cells in the same retina, or to Xath5GR-expressing cells receiving ethanol solvent (top panel). (b) Sorted Xath5GR-positive cells lose ATP faster after NaN3 addition compared to Xath5GR-negative cells in the same retina (n=4, p<0.05 at t=20). (c) The ratio of ATP remaining after NaN3 in construct-expressing : non-expressing cells from the same retinas is <1 at t=20 in the Xath5GR+Dex condition and not when dexamethasone is omitted or when GFP mRNA is injected with or without dexamethasone (n=4, p=0.04). (d) GPI does not change the proportion of cells incorporating the nucleotide analogue ethynyl deoxyuridine (EdU) in DNA after a brief pulse, nor the amount of EdU per cell (n=9). (e) GPI for 8-10 hours in explants in MBS does not change the amount of the nucleotide analogue 5-ethynyl uridine (EU) incorporated into RNA (n=6). The dashed histogram shows the background fluorescence after inhibition of RNA synthesis with Actinomycin D. Quantification is shown in Fig. 5h. (f) Incubation of stage 25 embryos for 1 or 2 days with GPI in vivo does not change the proportion of isl1+ differentiated cells present by stages 33/4 or 39 (n=9, p>0.05). (g) Incubation of stage 25 explants for 1 day with GPI in 1x MBS does not change the proportion of isl1+ differentiated cells present by stage 35/6 (n=4, p>0.05). (h) Incubation of stage 25 embryos for 1 or 2 days with GPI in vivo does not change the proportion of cells that are labelled by a pulse of EdU and therefore have not exited the cell cycle by stages 33/4 or 39 (n=5, p>0.05).
Figure 5
Figure 5
Complete glycolytic block inhibits progenitor proliferation, biosynthesis and survival. (a) ATP in explants in MBS does not change after 30 minutes of GPI+2DG (n=20). (b) Intracellular lactate after 3 hours of GPI and/or 2DG (data from the same set of experiments as Fig. 3c and Supplementary Fig. 1f; GPI + 2DG, n=6, p=0.003 compared to control, p>0.05 compared to GPI). (c-f) GPI+2DG but not either drug alone, for 8-10 hours in MBS in explants: (c-d) reduces EdU incorporation per cell after a short pulse (n=4, p=0.006) (black bar indicates shift in histogram) but not % EdU+ cells, (e) increases the proportion of S phase cells which do not incorporate EdU (n=3, p=0.02), (f) causes cells to accumulate in S phase (observed in 10/11 experiments for GPI+2DG; 3/13 for GPI and 1/11 for 2DG). (g) The nucleotide analogue 5-ethynyl-uridine (EU) is incorporated in RNA at much higher levels in CMZ proliferating cells and in photoreceptors compared to other retinal differentiated cells in vivo (stage 41). (h-k) GPI + 2DG but not either drug alone (h) reduces incorporation of EU into RNA in S/G2 (n=4, p=0.03), (i-j) reduces incorporation of the methionine analogues AHA or HPG into proteins in G1 (n=4, p=0.02) and S/G2 (n=4, p=0.02) (dashed histogram is background fluorescence when the protein synthesis inhibitors cycloheximide + anisomycin are used with AHA), and (k) increases the proportion of active-caspase-3+ apoptotic cells (n=5, p=0.03).

References

    1. Warburg O. On the origin of cancer cells. Science. 1956;123:309–314. - PubMed
    1. Vander Heiden MG, Cantley LC, Thompson CB. Understanding the Warburg effect: the metabolic requirements of cell proliferation. Science. 2009;324:1029–1033. - PMC - PubMed
    1. Gatenby RA, Gillies RJ. Why do cancers have high aerobic glycolysis? Nat Rev Cancer. 2004;4:891–899. - PubMed
    1. Jorgensen P, Steen JAJ, Steen H, Kirschner MW. The mechanism and pattern of yolk consumption provide insight into embryonic nutrition in Xenopus. Development. 2009;136:1539–1548. - PMC - PubMed
    1. Holt CE, Bertsch TW, Ellis HM, Harris WA. Cellular determination in the Xenopus retina is independent of lineage and birth date. Neuron. 1988;1:15–26. - PubMed

Publication types