. 2012 Aug;19(8):744-53.
doi: 10.1038/nsmb.2308. Epub 2012 Jul 1.

Proofreading of pre-40S ribosome maturation by a translation initiation factor and 60S subunits

Affiliations

Proofreading of pre-40S ribosome maturation by a translation initiation factor and 60S subunits

Simon Lebaron et al. Nat Struct Mol Biol. 2012 Aug.

Abstract

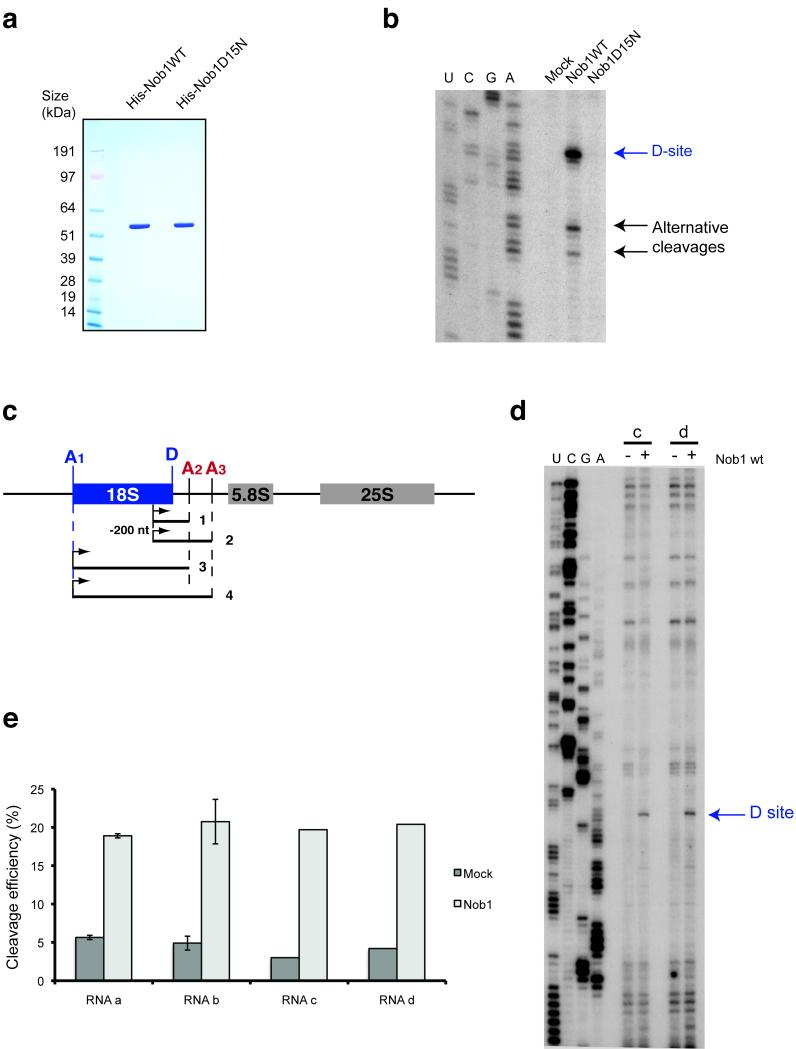
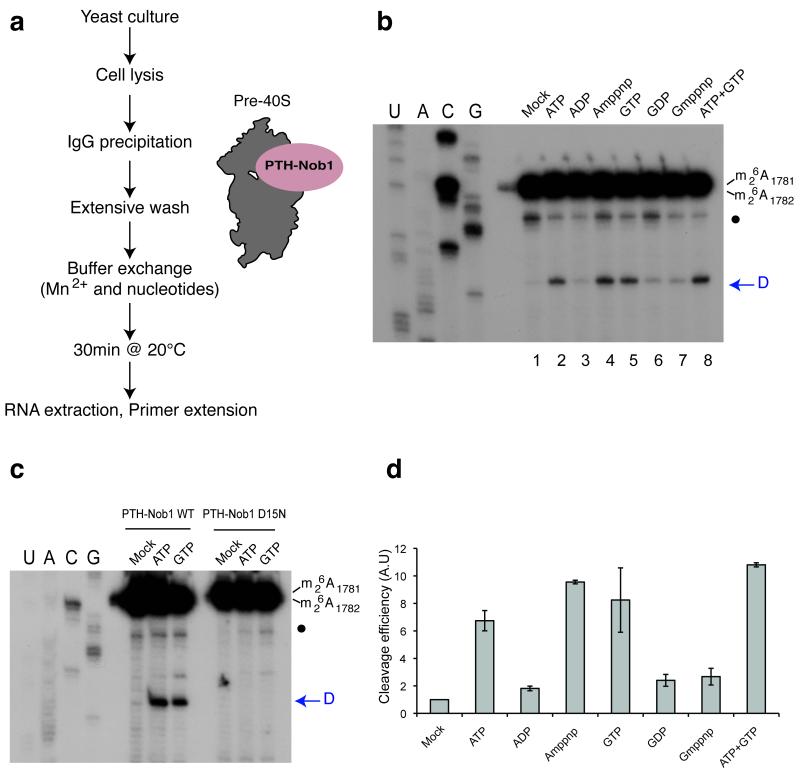
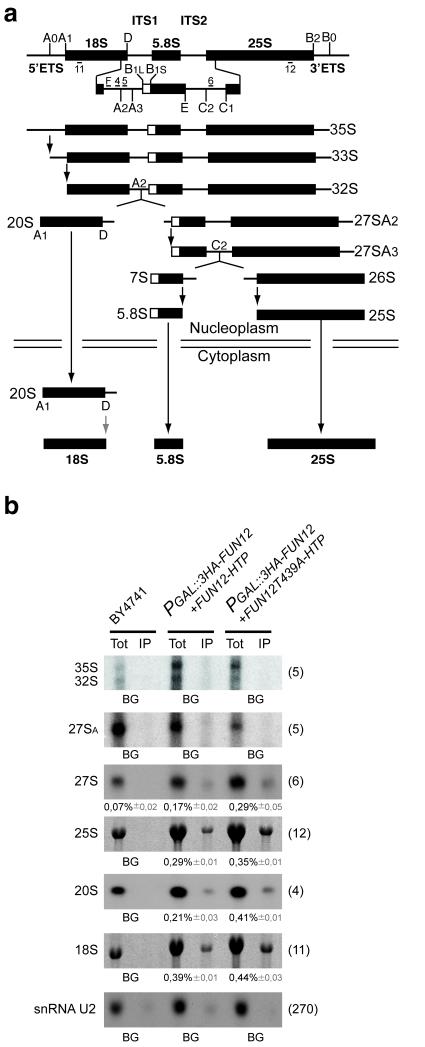
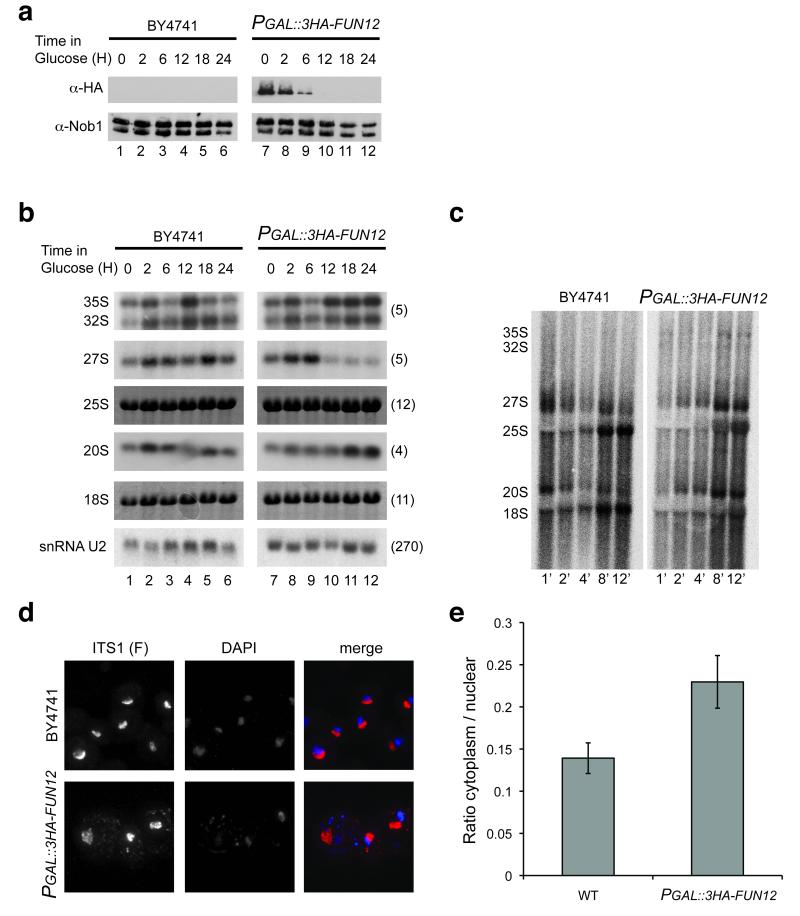
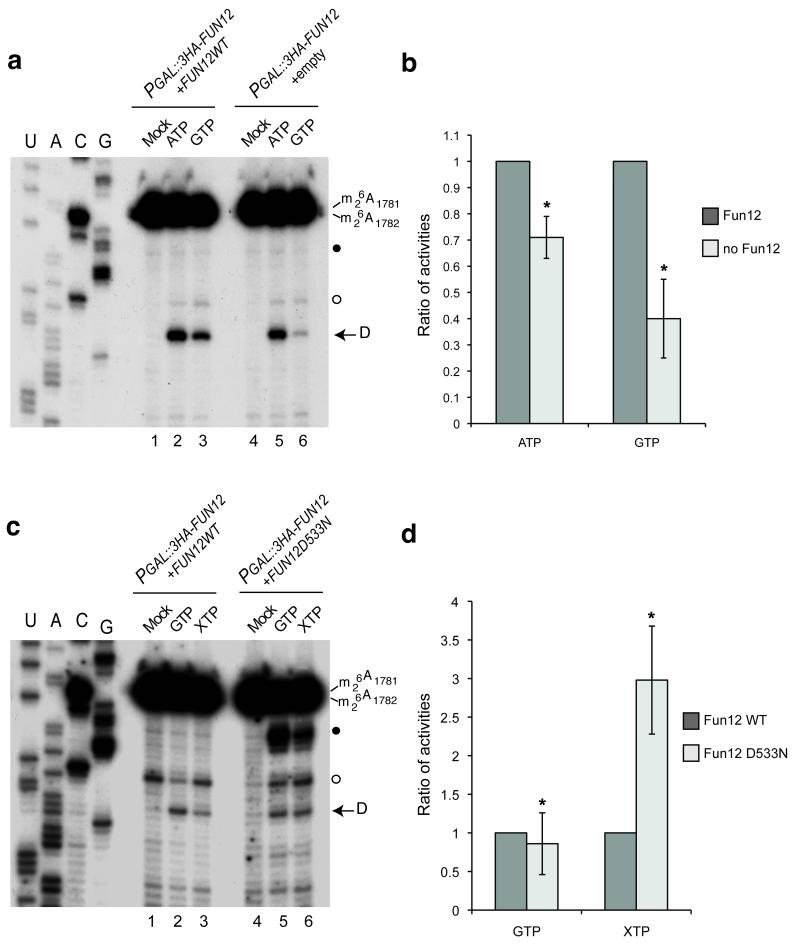
In the final steps of yeast ribosome synthesis, immature translation-incompetent pre-40S particles that contain 20S pre-rRNA are converted to the mature translation-competent subunits containing the 18S rRNA. An assay for 20S pre-rRNA cleavage in purified pre-40S particles showed that cleavage by the PIN domain endonuclease Nob1 was strongly stimulated by the GTPase activity of Fun12, the yeast homolog of cytoplasmic translation initiation factor eIF5b. Cleavage of the 20S pre-rRNA was also inhibited in vivo and in vitro by blocking binding of Fun12 to the 25S rRNA through specific methylation of its binding site. Cleavage competent pre-40S particles stably associated with Fun12 and formed 80S complexes with 60S ribosomal subunits. We propose that recruitment of 60S subunits promotes GTP hydrolysis by Fun12, leading to structural rearrangements within the pre-40S particle that bring Nob1 and the pre-rRNA cleavage site together.


Figures

Figure 1
Figure 1
In vitro RNA cleavage by Nob1 is not affected by sequences 3′ to site A2. (a) Recombinant forms of wild-type and mutant Nob1 were purified over nickel resin followed by gel filtration. 2 μg of each protein was loaded on an SDS-gel and Coomassie stained. (b) Cleavage assay on in vitro transcribed RNA. In vitro transcribed RNA was incubated with wild-type or mutant Nob1 and analyzed by primer extension. The major cleavage at site D is indicated, as are alternative cleavage sites, which were previously observed in vitro at sequences similar to site D . (c) Structures of long RNA substrates, mimicking the pre-rRNA before A2 cleavage (substrates 2 and 4) and after A2 cleavage (substrates 1 and 3). (d,e) The cleavage efficiency was determined by primer extension on the two longer RNA substrates (3 and 4) (d) and quantified using northern hybridization data (e). The ratio between cleaved fragment (D-A2) and intact RNA is presented as a histogram. These experiments were repeated for the shorter RNAs (substrates 1 and 2) but were performed only once for substrates 3 and 4 (with 5′ ends at site A1) due to the difficulties in purifying these long RNA species.
Figure 2
Figure 2
In vitro cleavage in pre-40S particles is stimulated by ATP or GTP addition. (a) Diagram representing steps in the assay for in vitro 40S subunit maturation. (b) Primer extension analysis showing the activation of in vitro site D cleavage in pre-40S particles by nucleotide addition. The strong upper stops result from termination at the sites of 18S rRNA base-methylation at A1779 and A1780. These modifications precede site D cleavage in vivo. The blue arrow indicates site D. A closed circle indicates an additional primer extension stop seen in some experiments, which corresponds to a run of G-C base-pairs at the foot of H45 in the 18S rRNA. The nucleotides indicated were added at 1mM. (c) Comparison of cleavage stimulation observed with pre-40S particles purified using wild-type (PTH-Nob1 WT) or the catalytically inactive PTH-Nob1D15N protein. (d) Variation of cleavage efficiencies in relation to nucleotide addition. Signals obtained for cleavage at site D in panel (b) were quantified, corrected for RNA loading (using a common stop in the ITS1 as a standard) and normalized to the mock-treated sample (set to 1). The average of three independent experiments is shown, with the standard deviation indicated on top of the histogram.
Figure 3
Figure 3
Fun12 is associated with pre-rRNA. (a) Pre-rRNA processing pathway and probe locations. Probe F was Cy3 labeled and used for the FISH analyses shown in Figures 4 and 6. (b) Co-precipitation of pre-rRNA and rRNA with Fun12-HTP and GTPase defective Fun12T439A-HTP. 1.5% of the input was loaded as total RNA (Tot). RNA was separated on a 1.2% agarose gel containing glyoxal and transferred to Hybond N+ prior to hybridization with the probes indicated in the left of the panels. The ratio between the two signals was quantified and the co-precipitation efficiency determined from three independent experiments for each pre-rRNA species is presented with the standard deviation shown in gray. Hybridization probes used are indicated on the left of the panels.
Figure 4
Figure 4
Fun12 is required for efficient pre-20S processing. (a) Western-blot analysis of Fun12 depletion using an anti-HA antibody. Effects of Fun12 depletion on general protein levels were determined using an anti-Nob1 antibody. Proteins were extracted from cells growing on galactose medium (0 h) and following transfer to glucose medium for the times indicated. (b) Northern hybridization analysis of pre-rRNA processing during Fun12 depletion. (c) Pulse-chase labeling of pre-rRNA processing in wild-type and P GAL::3HA-FUN12 strains. Following transfer to glucose medium for 20 h, cells were labeled with [3H] uracil for 2 min and chased with unlabeled uracil for the times indicated. Labeled RNA was visualized using a Fuji imager. (d) FISH analysis of wild-type and PGAL::3HA-FUN12 strains, following transfer to glucose medium for 20 h. Cells were hybridized with Cy3-labeled oligonucleotide F complementary to the 5′ region of ITS1, which is present in the 20S pre-rRNA and all earlier precursors. The nucleoplasm is labeled with DAPI. (e) Quantitation of FISH data. Signals were integrated over the nuclear and cytoplasmic areas of maximum projections. 15 individual cells were analyzed for each strain.
Figure 5
Figure 5
Fun12 is responsible for GTP-stimulation of in vitro cleavage. (a) Strain YSLD69 (PGAL::3HA-NOB1; PGAL::3HA-FUN12; pRS415-PTH-Nob1) was transformed with empty (empty) or PADH1::FUN12 plasmids. Following transfer to glucose medium for 12 h pre-40S particles were purified using PTH-Nob1 and cleavage at site D determined as in Fig. 2. (b) Cleavage efficiencies observed after addition of ATP or GTP were quantified relative to the control. The ratios of the activities observed from cell lysates expressing or depleted of Fun12 are presented (* P<0.2). (c) Site D cleavage in PTH-Nob1 pre-40S fractions isolated from strain YSLD69 carrying either a plasmid allowing low level expression of wild-type, non-tagged Fun12 under the control of a MET25 promoter or a plasmid expressing the Fun12D533N mutant that allows hydrolysis of XTP. Cells were transferred to medium containing 2% glucose and 8 mg l−1 methionine (2.5 fold lower than the normal concentration) for 10 h before pre-40S purification and analysis as in Fig. 2. (d) Activities induced by either GTP or XTP were quantified in comparison to the mock control. The ratio of the activities observed in cell lysates expressing Fun12 WT or mutant is presented (* P<0.2).
Figure 6
Figure 6
Fun12 binding to 25S rRNA is required for efficient 20S processing. (a) 25S region involved in subunit joining. Fun12 binding sites are indicated by circled nucleotides. The snR75 interaction that directs methylation at Gm2288 is indicated in red. The accessory guide interaction is indicated in blue, along with the new target for snR75Mut2 at Gm2307. (b) Constructs expressing wild-type or mutant snR75. Red box; methylation guide. Blue box; accessory guide. In snR75Mut1, the accessory guide is non-functional. In snR75Mut2, the accessory guide is extended and confers ectopic methylation at Gm2307. The snoRNAs are expressed from the intron of the ACT1 gene flanked by PGAL and TADH, in a strain deleted for the SNR78-72 cluster. (c,d) Effects of expression of snR75Mut2 on pre-rRNA processing in vivo. (c) FISH analysis as in Figure 4d. (d) Northern analysis of pre-rRNAs using the probes indicated on the left. Mature rRNAs were visualized by EthBr staining. (e) Cleavage assay as in Figure 2 in lysates from cells expressing snR75 or snR75Mut2. Lanes 1 and 4, cleavage without added GTP. Lanes 2 and 5, with 1mM GTP. Lanes 3 and 6, with 1mM GTP plus 100pmol of purified ribosomal subunits (ribs). (f) Quantification of cleavage efficiency.
Figure 7
Figure 7
Pre-40S particles stably associate with Fun12 and mature 60S prior to final 40S maturation. (a) Pre-40S particles were purified from cells expressing Fun12-HA, using Nob1-HTP as bait. Control cells expressed Fun12-HA but not Nob1-HTP. Recovery of Nob1-HTP (α-Nob1) and association of Fun12-HA (α-HA) with pre-40S particles were tested by western blot. 2% of total extract (Tot) and 100% of the IPs (IP) were loaded. (b) 25S rRNA is specifically associated with PTH-Nob1 in vivo. RNAs associated with PTH-Nob1 or with catalytically inactive PTH-Nob1D15N were analyzed on an agarose gel (IP). 1.5% of the input was loaded as a total (Tot). Non-tagged cells were used as control. (c) 25S:20S ratios co-precipitated with PTH-Nob1 or PTH-Nob1D15N, quantified by EthBr staining and normalized for their relative lengths (* P<0.2). (d) Pre-40S particles purified using Nob1-HTP or PTH-Nob1D15N were analyzed by size exclusion. Comparison to a calibration curve (data not shown) revealed that the two major peaks correspond to 80S (“80S”) and 40S particles (pre-40S). The distribution of Nob1 was assessed by western blot (middle panel) and quantified using a Licor odyssey system (lower panel). (e) EM imaging with negative staining showing representative views of particles from the two peaks.
Figure 8
Figure 8
Model for the role of Fun12 (eIF5b) in pre-40S processing. (a,b) Side view of mature 50S particles . Panel (b) is a zoom of the region indicated by a square in panel (a). The head (cream) and body (green) are highlighted. Six nts at the 3′ end of 18S are represented in green as a surface (nt −6 to −4) or as beads (nt −3 to 3′). The Nob1 binding site is indicated in blue. Positions of ribosomal proteins Rps5 and Rps14, which are involved in site D cleavage, are highlighted in black. The path of the mRNA across the 40S subunit is indicated . (c) Model of steps potentially driving cleavage at site D. (c1) ITS1 is proposed to be located in the mRNA-binding cleft. (c2) Fun12 (purple) binds pre-40S particles together with the 60S subunit. (c3) GTP hydrolysis by Fun12 drives movement of the head domain and displaces ITS1 within the mRNA binding cleft, bringing site D towards Nob1. 40S head to body rotation is proposed to participate in bringing the Nob1 active site together with site D. (c4) Cleavage of ITS1 and release of Nob1 generates mature, translation-competent 40S subunits.

Comment in

Similar articles

Cited by

References

    1. Inoue K, Alsina J, Chen J, Inouye M. Suppression of defective ribosome assembly in a rbfA deletion mutant by overexpression of Era, an essential GTPase in Escherichia coli. Mol. Microbiol. 2003;48:1005–1016. - PubMed
    1. Granneman S, Petfalski E, Swiatkowska A, Tollervey D. Cracking pre-40S ribosomal subunit structure by systematic analyses of RNA-protein cross-linking. EMBO J. 2010 - PMC - PubMed
    1. Li Z, et al. Rational Extension of the Ribosome Biogenesis Pathway Using Network-Guided Genetics. PLoS Biol. 2009;7:e1000213. - PMC - PubMed
    1. Campbell TL, Brown ED. Genetic interaction screens with ordered overexpression and deletion clone sets implicate the Escherichia coli GTPase YjeQ in late ribosome biogenesis. J. Bacteriol. 2008;190:2537–2545. - PMC - PubMed
    1. Lo KY, et al. Defining the pathway of cytoplasmic maturation of the 60S ribosomal subunit. Mol. Cell. 2010;39:196–208. - PMC - PubMed

Publication types

MeSH terms