. 2012 Jul 1;44(8):881-5.
doi: 10.1038/ng.2334.

Structural haplotypes and recent evolution of the human 17q21.31 region

Affiliations

Structural haplotypes and recent evolution of the human 17q21.31 region

Linda M Boettger et al. Nat Genet. .

Abstract

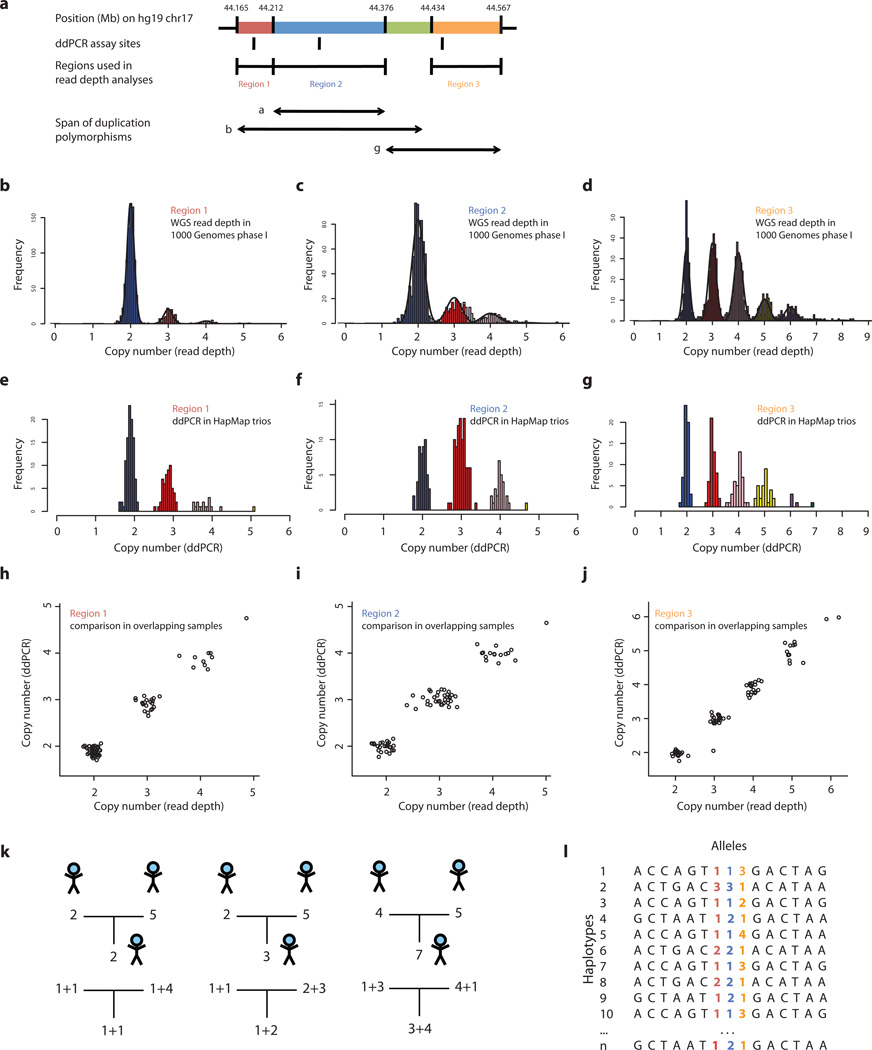
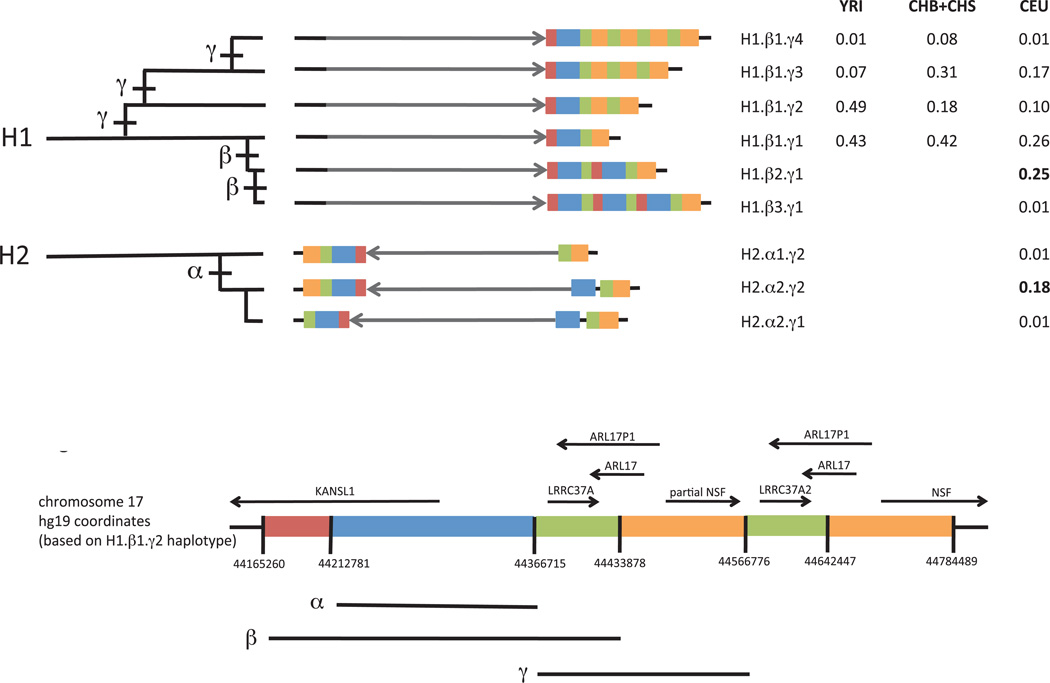
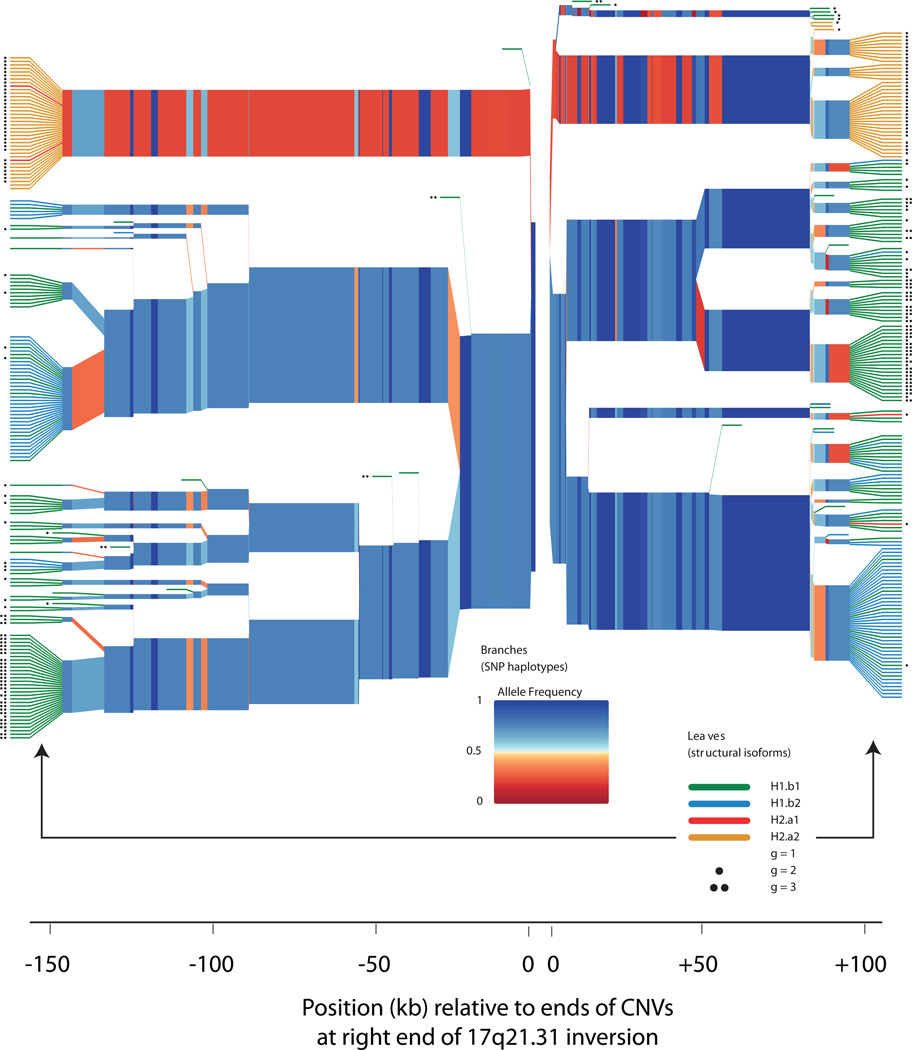
Structurally complex genomic regions are not yet well understood. One such locus, human chromosome 17q21.31, contains a megabase-long inversion polymorphism, many uncharacterized copy-number variations (CNVs) and markers that associate with female fertility, female meiotic recombination and neurological disease. Additionally, the inverted H2 form of 17q21.31 seems to be positively selected in Europeans. We developed a population genetics approach to analyze complex genome structures and identified nine segregating structural forms of 17q21.31. Both the H1 and H2 forms of the 17q21.31 inversion polymorphism contain independently derived, partial duplications of the KANSL1 gene; these duplications, which produce novel KANSL1 transcripts, have both recently risen to high allele frequencies (26% and 19%) in Europeans. An older H2 form lacking such a duplication is present at low frequency in European and central African hunter-gatherer populations. We further show that complex genome structures can be analyzed by imputation from SNPs.


Figures

Figure 1
Figure 1
Inference of complex CNV and SNP haplotypes at the 17q21.31 locus. Copy number of three copy-number-variable segments of 17q21.31 (a) was measured in populations using two approaches: analysis of read depth in whole-genome sequence (WGS) libraries available for 942 individuals from the 1000 Genomes Project phase 1, which we applied to measure copy number of region 1 (b), region 2 (c), and region 3 (d); and a droplet-based digital PCR (ddPCR) approach, which we applied to analyze father-mother-offspring trios from HapMap at specific sites within region 1 (e), region 2 (f), and region 3 (g). (Note that the frequencies of these copy-number classes are not identical in b–d and e–g, as their frequencies stratify by population and the samples surveyed overlap only partially.) These determinations of copy number were concordant for genomes analyzed by both methods in region 1 (h), region 2 (i), and region 3 (j). Analysis of the segregation of copy-number levels in trios allowed the contribution of transmitted and untransmitted chromosomes to diploid copy number to be determined in most trios (k). This in turn allowed CNV alleles to be phased with one another and with SNPs to create reference haplotypes (l).
Figure 2
Figure 2
Structural forms of the human 17q21.31 locus and their frequencies in populations. Each haplotype is represented in a simplified form to highlight major structural differences. The schematic at bottom indicates which genomic segment is represented by each color; detailed schematics with physical coordinates are available in Supplementary Material. The grey arrow indicates orientation of the unique inverted region within 17q21.31. Duplications of a 150-kb genomic segment (blue) containing the 5’ exons of the KANSL1 gene appear to have arisen on both the H1 and H2 forms of the 17q21.31 inversion polymorphism and reached high allele frequency in West Eurasian populations. The H1-polymorphic duplication β (red, blue, green) is longer than the H2-polymorphic duplication α (blue). A third duplication polymorphism γ (orange, green) affecting the NSF gene also varies in copy number. These structural polymorphisms segregate as the nine common haplotypes shown. The H2 inversion form shows structural diversity that was heretofore unappreciated, including a simpler, less common structural form (H2.α1) that may be the ancestral H2 structure. The table to the right lists allele frequencies for the nine structural haplotypes in different populations. CEU: Utah residents with Northern and West European ancestry. CHB: Han Chinese in Beijing. CHS: Han Chinese South. YRI: Yoruba in Ibadan, Nigeria. Genotype and allele frequencies in 12 populations are available as Supplementary Tables 2–9. Most of these haplotypes correspond one-to-one to haplotypes identified in the contemporaneous work by Steinberg et al.: H1.β1.γ1 corresponds to H1.1; H1.β1.γ2 to H1.2 ; H1.β1.γ3 to H1.3; H1.β2.γ1 to H1D; H1.β3.γ1 to H1D.3; H2.α1.γ1 to H2.1; H2.α1.γ2 to H2.2; and H2.α2.γ2 to H2D.
Figure 3
Figure 3
Structural forms of 17q21.31 segregate on specific SNP haplotype backgrounds. The plot shows homozygosity and divergence (due to mutation and recombination) of the SNP haplotypes on which each structural form segregates in the European (CEU) trios analyzed in HapMap phase 3. The polymorphic CNV copies at the right end of the 17q21.31 inversion (Fig. 2) reside between the two origins of this plot (at center). SNPs on the left half of the plot therefore reside within the unique inverted region of 17q21.31, while SNPs on the right half of the plot are distal to the 17q21.31 inversion. On the branches, each colored segment represents the state of a SNP, with color representing allele frequency; branch points represent markers at which the depicted haplotypes diverge due to mutation and/or recombination with other haplotypes. The colored leaves and dots indicate the structural forms associated with each SNP haplotype. (Red leaves, H2.α1; orange leaves, H2.α2; green leaves, H1.β1; blue leaves, H1.β2; black dots, extra copies of the γ duplication.) In the plot, the structures are represented on the leaves in order to clarify their relationships to SNP haplotypes, but the variable parts of these CNVs actually reside (in genomic space) within the gap at center between the two origins on the plot. The structural forms segregate on characteristic SNP haplotypes, both inside and outside the inversion region. Statistical imputation of structural alleles utilizes SNPs on both sides of the CNVs together with more-distant markers not shown here.

References

    1. Stefansson H, et al. A common inversion under selection in Europeans. Nat Genet. 2005;37:129–137. - PubMed
    1. Chowdhury R, Bois PR, Feingold E, Sherman SL, Cheung VG. Genetic analysis of variation in human meiotic recombination. PLoS Genet. 2009;5:e1000648. - PMC - PubMed
    1. Fledel-Alon A, et al. Variation in human recombination rates and its genetic determinants. PLoS One. 2011;6:e20321. - PMC - PubMed
    1. Skipper L, et al. Linkage disequilibrium and association of MAPT H1 in Parkinson disease. Am J Hum Genet. 2004;75:669–677. - PMC - PubMed
    1. Simon-Sanchez J, et al. Genome-wide association study reveals genetic risk underlying Parkinson's disease. Nat Genet. 2009;41:1308–1312. - PMC - PubMed

Publication types