Identification of embryonic stem cell-derived midbrain dopaminergic neurons for engraftment
- PMID: 22751106
- PMCID: PMC3408729
- DOI: 10.1172/JCI58767
Identification of embryonic stem cell-derived midbrain dopaminergic neurons for engraftment
Abstract
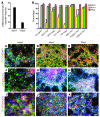
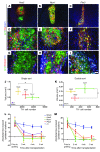
Embryonic stem cells (ESCs) represent a promising source of midbrain dopaminergic (DA) neurons for applications in Parkinson disease. However, ESC-based transplantation paradigms carry a risk of introducing inappropriate or tumorigenic cells. Cell purification before transplantation may alleviate these concerns and enable identification of the specific DA neuron stage most suitable for cell therapy. Here, we used 3 transgenic mouse ESC reporter lines to mark DA neurons at 3 stages of differentiation (early, middle, and late) following induction of differentiation using Hes5::GFP, Nurr1::GFP, and Pitx3::YFP transgenes, respectively. Transplantation of FACS-purified cells from each line resulted in DA neuron engraftment, with the mid-stage and late-stage neuron grafts being composed almost exclusively of midbrain DA neurons. Mid-stage neuron cell grafts had the greatest amount of DA neuron survival and robustly induced recovery of motor deficits in hemiparkinsonian mice. Our data suggest that the Nurr1+ stage (middle stage) of neuronal differentiation is particularly suitable for grafting ESC-derived DA neurons. Moreover, global transcriptome analysis of progeny from each of the ESC reporter lines revealed expression of known midbrain DA neuron genes and also uncovered previously uncharacterized midbrain genes. These data demonstrate remarkable fate specificity of ESC-derived DA neurons and outline a sequential stage-specific ESC reporter line paradigm for in vivo gene discovery.
Figures


Similar articles
-
Expression of early developmental markers predicts the efficiency of embryonic stem cell differentiation into midbrain dopaminergic neurons.Stem Cells Dev. 2013 Feb 1;22(3):397-411. doi: 10.1089/scd.2012.0238. Epub 2012 Sep 20. Stem Cells Dev. 2013. PMID: 22889265 Free PMC article.
-
Dopamine neurons derived from human ES cells efficiently engraft in animal models of Parkinson's disease.Nature. 2011 Nov 6;480(7378):547-51. doi: 10.1038/nature10648. Nature. 2011. PMID: 22056989 Free PMC article.
-
Prolonged membrane depolarization enhances midbrain dopamine neuron differentiation via epigenetic histone modifications.Stem Cells. 2011 Nov;29(11):1861-73. doi: 10.1002/stem.739. Stem Cells. 2011. PMID: 21922608
-
Midbrain dopaminergic neuron fate specification: Of mice and embryonic stem cells.Mol Brain. 2008 Sep 30;1:8. doi: 10.1186/1756-6606-1-8. Mol Brain. 2008. PMID: 18826576 Free PMC article. Review.
-
Molecular and cellular determinants for generating ES-cell derived dopamine neurons for cell therapy.Adv Exp Med Biol. 2009;651:112-23. doi: 10.1007/978-1-4419-0322-8_11. Adv Exp Med Biol. 2009. PMID: 19731556 Review.
Cited by
-
Improved cell therapy protocols for Parkinson's disease based on differentiation efficiency and safety of hESC-, hiPSC-, and non-human primate iPSC-derived dopaminergic neurons.Stem Cells. 2013 Aug;31(8):1548-62. doi: 10.1002/stem.1415. Stem Cells. 2013. PMID: 23666606 Free PMC article.
-
Regenerative Medicine for the Aging Brain.Enliven J Stem Cell Res Regen Med. 2014;1(1):1-9. Enliven J Stem Cell Res Regen Med. 2014. PMID: 25699290 Free PMC article.
-
Building on a Solid Foundation: Adding Relevance and Reproducibility to Neurological Modeling Using Human Pluripotent Stem Cells.Front Cell Neurosci. 2021 Nov 18;15:767457. doi: 10.3389/fncel.2021.767457. eCollection 2021. Front Cell Neurosci. 2021. PMID: 34867204 Free PMC article.
-
Transcriptional landscape of myogenesis from human pluripotent stem cells reveals a key role of TWIST1 in maintenance of skeletal muscle progenitors.Elife. 2020 Feb 3;9:e46981. doi: 10.7554/eLife.46981. Elife. 2020. PMID: 32011235 Free PMC article.
-
Modeling Human Neurological and Neurodegenerative Diseases: From Induced Pluripotent Stem Cells to Neuronal Differentiation and Its Applications in Neurotrauma.Front Mol Neurosci. 2017 Feb 28;10:50. doi: 10.3389/fnmol.2017.00050. eCollection 2017. Front Mol Neurosci. 2017. PMID: 28293168 Free PMC article. Review.
References
-
- Hedlund E, et al. Embryonic stem cell-derived Pitx3-enhanced green fluorescent protein midbrain dopamine neurons survive enrichment by fluorescence-activated cell sorting and function in an animal model of Parkinson’s disease. Stem Cells. 2008;26(6):1526–1536. doi: 10.1634/stemcells.2007-0996. - DOI - PMC - PubMed
Publication types
MeSH terms
Substances
Grants and funding
LinkOut - more resources
Full Text Sources
Other Literature Sources
Molecular Biology Databases

