. 2013 May 16;32(20):2576-85.
doi: 10.1038/onc.2012.266. Epub 2012 Jul 2.

RREB1 repressed miR-143/145 modulates KRAS signaling through downregulation of multiple targets

Affiliations

RREB1 repressed miR-143/145 modulates KRAS signaling through downregulation of multiple targets

O A Kent et al. Oncogene. .

Abstract

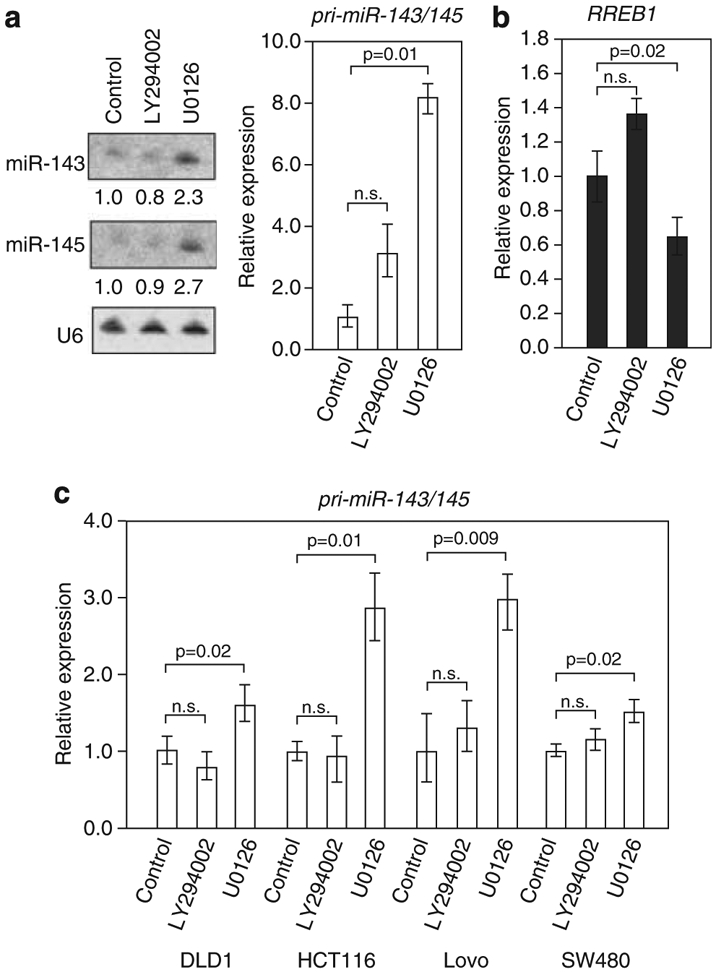
A lack of expression of miR-143 and miR-145 has been demonstrated to be a frequent feature of colorectal tumors. Activating KRAS mutations have been reported in 30-60% of colorectal cancers and an inverse correlation between Kras and miR-143/145 expression has been observed. Previously, we have demonstrated that oncogenic Kras leads to repression of the miR-143/145 cluster in pancreatic cancer and is dependent on the Ras responsive element (RRE) binding protein (RREB1), which negatively regulates miR-143/145 expression. In the present study, we have found that RREB1 is overexpressed in colorectal adenocarcinoma tumors and cell lines, and the expression of the miR-143/145 primary transcript is inversely related to RREB1 expression. In colorectal cancer cell lines, the miR-143/145 cluster is repressed by RREB1 downstream of constitutively active KRAS. RREB1 is activated by the MAPK pathway and negatively represses the miR-143/145 promoter through interaction with two RREs. In addition, overexpression of miR-143 or miR-145 in HCT116 cells abrogates signaling through the MAPK, PI3K and JNK pathways by downregulation of both KRAS and RREB1 in addition to downregulation of a cohort of genes in the MAPK signaling cascade. These results establish a complex network of regulation through which the miR-143/145 cluster is able to modulate KRAS signaling in colorectal cancer.


Conflict of interest statement

CONFLICT OF INTEREST

The authors declare no conflict of interest.

Figures

Figure 1.
Figure 1.
RREB1 expression in colorectal cancer. (a) RREB1 expression in normal colon versus colon adenocarcinoma. The P-value indicated fold change 1.5-fold. (b) RREB1 IHC in anonymous colon cancer (T) samples. Positive RREB1 staining is brown. Original magnification × 160. (c) RREB1 IHC in normal colon samples. For orientation, the muscularis mucosa, representing the base of the glandular colonic tissue, is present at the bottom of each panel and the colonic lumen is present at the top. (d) Quantification of positive RREB1 staining at the top and bottom of colonic crypts. Analysis using Aperio Score parameter generated for 14 separate clusters of 10+ neighboring crypt segments. The P-value calculated using a paired t-test for means. (e) Log2 normalized qRT–PCR expression analysis of RREB1 mRNA and miR-143/145 primary transcript expression in a panel of colorectal carcinoma cell lines and three normal colon tissue samples (Colon-1, 2, 3). The activating KRAS mutation found in each cell line is indicated. *Activating BRAF mutation.
Figure 2.
Figure 2.
Kras regulation of RREB1 leads to repression of miR-143/145. (a) qRT–PCR analysis of KRAS, RREB1 and pri-miR-143/145 expression in DLD1 and HCT116 cell lines transfected with negative control or KRAS-targeting or RREB1-targeting siRNAs. Error bars for this and subsequent panels represent standard deviations from three independent measurements. (b) qRT–PCR analysis of RREB1 and pri-miR-143/145 expression in DLD1 and HCT116 cell lines with (KRAS) or without (Null) oncogenic KRAS. (c) TaqMan analysis of miR-143 and miR-145 expression in DLD1 and HCT116 cell lines with (KRAS) or without (Null) oncogenic KRAS. For all panels, the P-value calculated using a paired t-test (n.s. not significant was P>0.05).
Figure 3.
Figure 3.
Small molecule inhibition of the MAPK pathway derepresses the miR-143/145 cluster. (a) Northern blot analysis of miR-143 and miR-145 (left) and qRT–PCR analysis of pri-miR-143/145 expression (right) in HPNE-KrasG12D cells treated with DMSO (control), or LY294002 or U0126. (b) qRT–PCR analysis of RREB1 expression in HPNE-KrasG12D cells treated with DMSO (control), LY294002 or U0126. (c) qRT–PCR analysis of pri-miR-143/145 expression in DLD1, HCT116, Lovo and SW480 cell lines treated with the indicated small molecule inhibitors. For all panels, the P-value calculated using a paired t-test (n.s. not significant was P>0.05).
Figure 4.
Figure 4.
miR-143/145 promoter contains two RREs regulated by RREB1. (a) Magnified view of the 5′end of the human miR-143/145 pri-miRNA showing evolutionary conservation of the proximal promoter region that contains two RREs (RRE-1 and RRE-2). Sequences of RRE-1 and RRE-2 are compared with the consensus RREB1 binding site. (b) Activity of the miR-143/145 promoter reporter construct in DLD1 and HCT116 cell lines with (KRAS) or without (Null) oncogenic KRAS. The P-value calculated using a paired t-test. (c) Activity of the wild-type and mutant miR-143/145 promoter reporter constructs in NIH3T3 and NIH3T3-Kras cells. Values represent firefly luciferase activity produced from each plasmid normalized to renilla luciferase activity produced from a co-transfected control vector. Error bars represent standard deviations from three independent transfections, each measured in triplicate. (d) qPCR analysis of FLAG-RREB1 chromatin immunoprecipitates in NIH3T3 cells. Signal obtained from the miR-143/145 promoter amplicons containing the RREB1 binding sites (RRE-1 and RRE-2), an amplicon 300 bp downstream (Dn) and a negative control amplicon 5 kb upstream (5 kb) are shown. Error bars represent standard deviations derived from three independent measurements and the P-value calculated using a paired t-test.
Figure 5.
Figure 5.
Several miR-143/145 targets are components in Kras signaling pathways. (ac) Western blot analysis of indicated protein expression (a, c) and qRT–PCR analysis of pri-miR-143/145 expression (b) in HCT116 cells treated with control mimic, miR-143 or miR-145 mimic, or untransfected. (d, e) Luciferase activity derived from the indicated 3′UTR reporter constructs following transfection into MiaPaCa2 cells with control mimic (−) or miR-143 mimics (d, +) or miR-145 mimics (e, +). All values were normalized to renilla luciferase activity produced from a co-transfected control plasmid. For each transfection condition, activity produced from the wild-type construct was normalized to the activity produced by the mutant construct. Error bars represent standard deviations from three independent transfections, each measured in triplicate. P-values for significant experiments indicated (two-tailed t-test) *Double miR-145 mutant. Colored bars represent statistically significantly results. (f, g) Western blot confirmation of miR-143 and miR-145 targets (f) or total JNK (t-JNK) or phospho-JNK (p-JNK) expression (g) in HCT116 cells treated with control mimic, miR-143 or miR-145 mimic or untransfected.

References

    1. Ambros V The functions of animal microRNAs. Nature 2004; 431: 350–355. - PubMed
    1. Bartel DP. MicroRNAs: genomics, biogenesis, mechanism, and function. Cell 2004; 116: 281–297. - PubMed
    1. Mendell JT. miRiad roles for the miR-17-92 cluster in development and disease. Cell 2008; 133: 217–222. - PMC - PubMed
    1. Chang TC, Wentzel EA, Kent OA, Ramachandran K, Mullendore M, Lee KH et al. Transactivation of miR-34a by p53 broadly influences gene expression and promotes apoptosis. Mol Cell 2007; 26: 745–752. - PMC - PubMed
    1. He L, He X, Lim LP, de Stanchina E, Xuan Z, Liang Y et al. A microRNA component of the p53 tumour suppressor network. Nature 2007; 447: 1130–1134. - PMC - PubMed

Publication types

MeSH terms