. 2012 Jul 1;13(8):787-95.
doi: 10.1038/ni.2364.

Integration of the movement of signaling microclusters with cellular motility in immunological synapses

Affiliations

Integration of the movement of signaling microclusters with cellular motility in immunological synapses

Peter Beemiller et al. Nat Immunol. .

Abstract

Immune synapses form between T cells and antigen-presenting cells (APCs). Increasing evidence suggests synapses must form flexibly to accommodate ongoing motility and displacement of the synapse. Here, time-lapse total internal reflection fluorescence (TIRF) microscopy showed that signaling via the T cell antigen receptor (TCR) occurred during synapse translation. TCR microclusters in motile synapses did not flow directly into supramolecular activating complexes (SMACs) but were directed, independently of myosin II contractility, toward an F-actin-poor 'sink' region. Inward microcluster flow often followed collapse of the leading edge, which suggested that actin depolymerization regulated microcluster flow and the formation of SMACs. The coordination of TCR movement with the translocation of this 'sink' shows how T cells coordinate TCR signaling and microcluster flow in dynamic physiological synapses.


Figures

Figure 1
Figure 1. T cells remain motile during TCR signaling triggered by a large range of agonist doses
(a) Top: cell speeds; bottom: baseline-normalized fura-2 ratios (relative calcium concentrations) and displacements of cells interacting with bilayers loaded with the indicated concentrations of pMHC. Error bars represent the standard error of the mean (s.e.m.). Bilayers loaded with 2.5×10⁷ fg/ml pMHC presented agonists at densities similar to peptide-pusled BMDCs. (b) Speeds versus cytosolic calcium concentration of the cells interacting with bilayers loaded with 2.5×10³ fg/ml pMHC. N = 96 cells. (c) Fura-2 ratiometric image sequences of prototypical synapses. Top: a paused synapse, where motility followed TCR signaling activity. Bottom: a motile synapse, where signaling occurred during motility. Images intensities were scaled to a normalized Fura-2 ratio intensity range of 1–2. For display purposes, images were filtered with a 0.4 μm σ Gaussian filter. Numbers below panels indicate time (min). Scale bar is 5 μm. (d) Fura-2 ratios and displacements for the cells in (c). (e) The fraction of cells that formed high motility synapses (≥3.8 μm/min average speed). Plot was generated using data from the cells sampled in (a) and from Supplementary Figure 1 (776 cells total). (f) The fraction of elevated calcium detected in the cells in (a) versus the cell displacement. Displacements were binned into 1 μm intervals relative to the site of bilayer binding. Plots in (a) represent >75 cells for each condition. Data were pooled from 2–4 bilayers per condition.
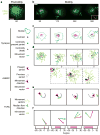
Figure 2
Figure 2. Microcluster flow aligns with movement in motile synapses
(a, b) Time-lapse TIRF images of a CD3ζ-GFP+ OT1+ T cell during synapse formation. Numbers below images indicate time (s) relative to the start of TCR centralization. Scale bars are 5 μm. (a) The microclusters paths prior to cell movement. (b) Synapse motility was divided into four periods based on the direction of movement (blue arrows). The borders of the cSMAC are shown in magenta. The paths followed by the cSMAC and synapse centroids are inset at lower right. (c) The cSMAC (magenta), synapse border (light-blue) and cSMAC border at the end of the preceding motility period (gray). (d) Displacement vectors for microclusters formed during each motility period overlaid onto the cSMAC mask at the start of the period (magenta). Dashed gray boxes show a magnified view of the indicated regions. (e) The median microcluster flow direction (green), and the direction of cSMAC movement (magenta) for each period. Arrowhead points are placed at the mean microcluster endpoint or cSMAC position at the end of the period. Cell centroids over the entire time series are shown (gray), with the centroids corresponding each period in blue. (f) Top: cell (blue), cSMAC (magenta) and median microcluster movement vectors (green) in each period, drawn with a common origin and scaled to the same magnitude. Bottom: angles between median microcluster movement vector and cell movement (green) and between cSMAC movement and cell movement (magenta) in each motility period. Data are representative of six synapses that transitioned to motility.
Figure 3
Figure 3. Synapse motility is independent of cSMAC formation
(a) Time-lapse TIRF microscopy images of CD3ζ-GFP during formation of a motile synapse. The synapse and cSMAC boundaries are outlined in light-blue and magenta, respectively. Scale bar is 5 μm. (b) The synapse (blue) and cSMAC centroids (magenta) over time for a motile and paused synapse. The cSMAC centroids were shifted to a common origin with the synapse, indicated by black arrow heads. (c) Synapse displacements and cSMAC areas (normalized to the maximum area) over time for the motile and paused synapses in (b). (d) Average speed of cells in motile synapses and the average normalized cSMAC area over time. The speed was smoothed with a 10-second moving window average. (e) Top: displacements over time of synapse and cSMAC centroids following cSMAC maturation (set to zero in the graph). Bottom: displacement rates for synapses and cSMACs. Error bars in (d,e) represent the standard deviation (s.d.). Nine synapses from a single set of bilayers were analyzed. (f) The cSMAC position and F-actin patterns in an asymmetric synapse (left) and motile synapse (right). The contours indicate: the border of the high F-actin density region (red), the border of the F-actin poor region (blue), and the cSMAC (yellow). 29 synapses were imaged and characterized as symmetric (not shown), asymmetric or motile. Approximately 30% of synapses were asymmetric and approximately 40% appeared motile.
Figure 4
Figure 4. TCR centralization and synapse dynamics are myosin II independent
(a) F-actin staining and cSMAC positioning in paused and motile synapses formed by control and blebbistatin treated cells. Approximately 50 control and 50 blebbistatin treated cells on two bilayers were imaged. (b) Mean speeds of control and blebbistatin treated cell synapses (p = 0.003; Mann-Whitney). (c) Displacements of control and blebbistatin treated cells on stimulating bilayers. Data in (b,c) represent 76 control and 76 treated cells. Gray bars in (c) represent the median. (d) Microcluster paths overlaid onto TIRF images of Alexa Fluor 568-H57-597 stained TCRs in control, conditional myosin II knockout (cKO), and blebbistatin treated OT1+ T cells. Scale bars in (a,d,f) are 5 μm. (e) Median centralization, average microcluster track speeds and mean track straightness for microclusters in 16 control, 12 cKO and 12 blebbistatin treated cells. Gray bars represent the median centralization or mean speed/straightness of the groups. One-way ANOVA analysis of the track parameters did not reveal significant (p < 0.05) differences. (f) The spreading dynamics of a control, cKO, and blebbistatin treated cell. Numbers below images indicate time (s) relative to maximum synapse area. (g) Quantified synapse areas of control, cKO and blebbistatin treated cells. N = 7 for each condition. Error bars in (c,g) represent the s.e.m. (h) The temporal derivative of the synapse areas. Rates were smoothed using a 10-sec moving average filter. (i) Synapse radii relative to volumetric radii for 15 control and 14 cKO cells. Gray bars represent the median (p = 0.116; Mann-Whitney test).
Figure 5
Figure 5. Actin polymerization and depolymerization organize synapses
(a) Time-lapse TIRF microscopy images of a Lifeact-GFP+ OT1+ T cell blast spreading onto a stimulating bilayer. Top: Alexa Fluor 568-H57-597 labeled TCRs; bottom: Lifeact-GFP (pseudocolor look-up table shown at lower-right). Numbers below image are time (s). Scale bar is 5 μm. (b) Linescan intensities for the 10 μm line L in (a). Intensities are the average of 3 pixels (0.48 μm). The solid gray line in (a) and (b) indicates the synapse border; the dashed gray line is 2 μm from the cell edge. (c) Distance to the cell edge along the line L. (d) The changes in Lifeact-GFP intensites over time (change in intensity units per second) in the 1 μm2 regions around the interior and edge microclusters. The dashed vertical line indicates the end of the spreading period. Data are representative of 8 synapse spreading.
Figure 6
Figure 6. Microcluster centralization correlates with F-actin depolymerization
(a) TIRF images of a CD3ζ-GFP+ OT1+ T cell synapse. Numbers below images indicate the time (s) relative to cell-bilayer contact. Scale bar is 5 μm. Light-blue arrow heads indicate the position of edge collapses. Yellow arrow indicates the direction of subsequent motility. Microclusters paths, color-coded by time according to the color bar, are overlaid with the image of the maximally spread synapse. (b) Plot of synapse area over time. (c) Radial displacement time series of the 111 microcluster tracks. (d) The average radial displacement for the 86 microcluster tracks that spanned the expansion-contraction process (magenta) and for the synapse edge (light-blue) at points associated with the microclusters. Error bars are the s.d. For clarity, edge error bars are omitted. (e,g) The average radial displacement of microclusters that formed within 2 μm of the synapse edge (e) and that formed in the interior (g) during synapse spreading by a Lifeact-GFP+ T cell. The dashed vertical lines in (b–d,e,g) correspond to the maximum synapse areas. (f, h) Correlation between Lifeact-GFP intensity changes in the 1 μm2 regions centered on the microclusters and the microcluster radial movements. Movements toward the synapse center are positive, while outward movement is negative. Edge microclusters are shown in (f), interior microclusters in (h). Results in (e–h) are representative of 8 synapses in which Lifeact-GFP was imaged during spreading and contraction.
Figure 7
Figure 7. TCR centralization requires actin depolymerization
(a) Synapse areas formed by OT1+ T cell blasts after treatment with DMSO vehicle, the indicated concentration of jasplakinolide or 10 μM cytochalasin D. (b) The fractions of OT1+ T cell blasts forming cSMACs after treatment with DMSO vehicle or the indicated concentration of jasplakinolide. For (a,b), N = 90–120 cells total, from four independent bilayers. Error bars represent the s.d. (a) or s.e.m. (b). (c) Calcium fluxes generated by Fura-2 loaded OT1+ T cell blasts on stimulating bilayers after treatment with DMSO vehicle or 50 nM jasplakinolide. Error bars represent the s.e.m. for 30 control or drug treated cells. (d,f) TIRF images of Lifeact-GFP (top) and TCRs (bottom) during synapse formation by a control OT1+ T cell blast (d) and an OT1+ T cell blast treated with 50 nM jasplakinolide treated (f). Numbers in (d,f) indicate the time (s) relative to the start of spreading. Scale bars are 5 μm. (e,g) Microcluster paths overlaid onto images of the cells from (d,f), respectively. (h–j) Median microcluster centralizations (h), average microcluster track speeds (i) and mean track straightness (j) during synapse formation by control cells and cells treated with 50 nM jasplakinolide. Data represent 16 control and 18 jasplakinolide treated cells. Gray bars represent the mean of the groups (p < 0.009 for all comparisons; Student’s t test).

References

    1. Krummel MF, Sjaastad MD, Wülfing C, Davis MM. Differential Clustering of CD4 and CD3ζ During T Cell Recognition. Science. 2000;289:1349–1352. - PubMed
    1. Grakoui A, et al. The immunological synapse: a molecular machine controlling T cell activation. Science. 1999;285:221–227. - PubMed
    1. Wülfing C, Davis MM. A Receptor/Cytoskeletal Movement Triggered by Costimulation During T Cell Activation. Science. 1998;282:2266–2269. - PubMed
    1. Monks CRF, Freiberg BA, Kupfer H, Sciaky N, Kupfer A. Three-dimensional segregation of supramolecular activation clusters in T cells. Nature. 1998;395:82–86. - PubMed
    1. Yokosuka T, et al. Newly generated T cell receptor microclusters initiate and sustain T cell activation by recruitment of Zap70 and SLP-76. Nat Immunol. 2005;6:1253–1262. - PubMed

Publication types

MeSH terms