. 2012 Jul 1;9(8):840-6.
doi: 10.1038/nmeth.2078.

High-throughput assessment of microRNA activity and function using microRNA sensor and decoy libraries

Affiliations

High-throughput assessment of microRNA activity and function using microRNA sensor and decoy libraries

Gavriel Mullokandov et al. Nat Methods. .

Abstract

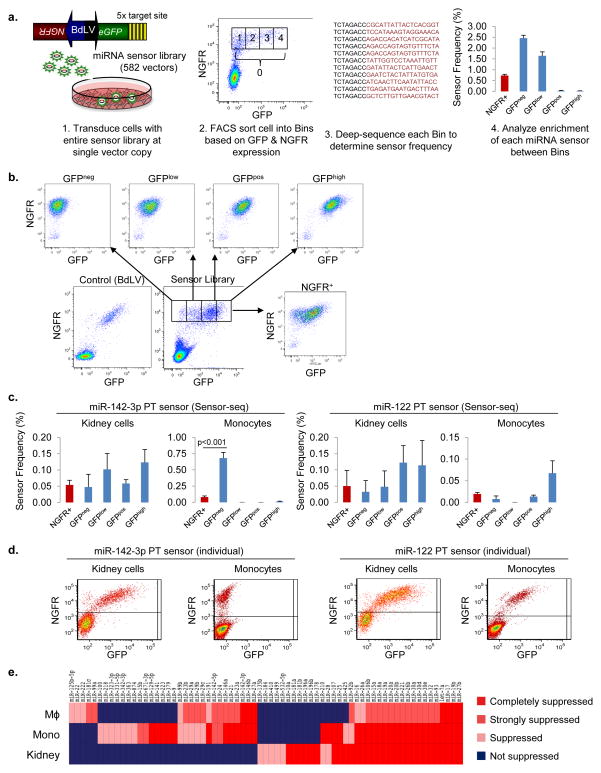
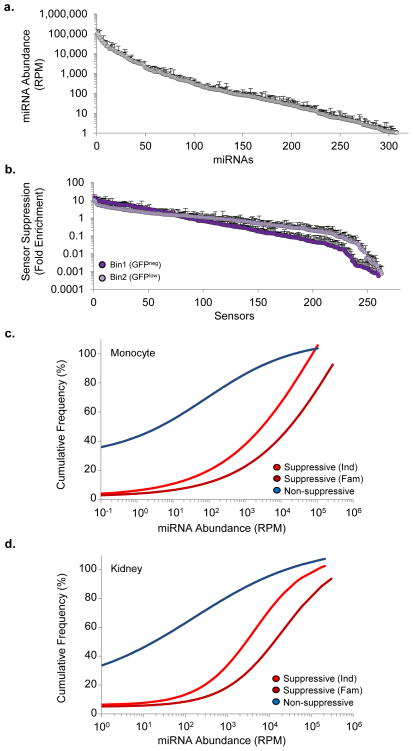
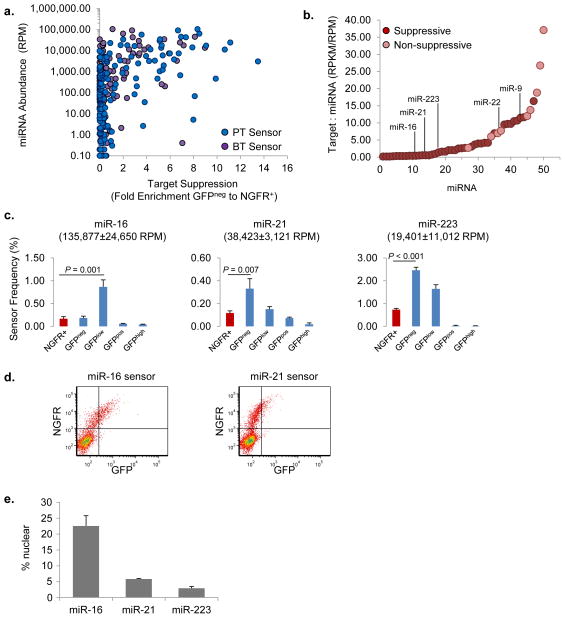
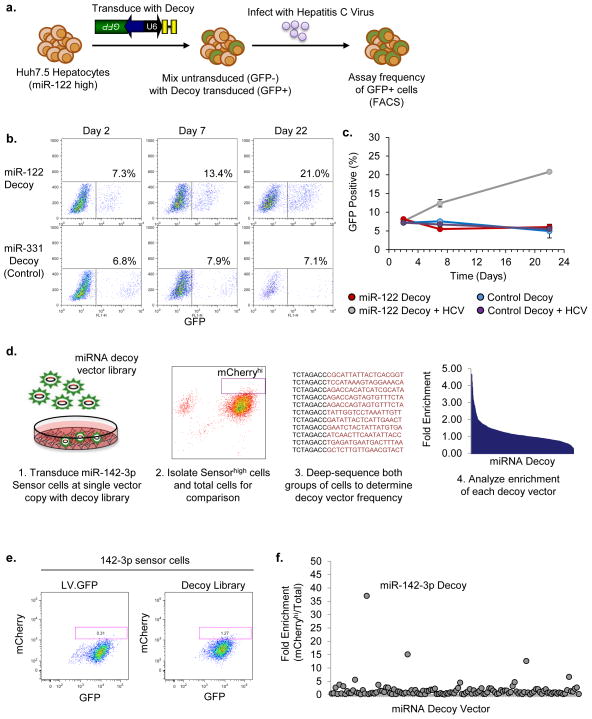
We introduce two large-scale resources for functional analysis of microRNA (miRNA): a decoy library for inhibiting miRNA function and a sensor library for monitoring microRNA activity. To take advantage of the sensor library, we developed a high-throughput assay called Sensor-seq to simultaneously quantify the activity of hundreds of miRNAs. Using this approach, we show that only the most abundant miRNAs in a cell mediate target suppression. Over 60% of detected miRNAs had no discernible activity, which indicated that the functional 'miRNome' of a cell is considerably smaller than currently inferred from profiling studies. Moreover, some highly expressed miRNAs exhibited relatively weak activity, which in some cases correlated with a high target-to-miRNA ratio or increased nuclear localization of the miRNA. Finally, we show that the miRNA decoy library can be used for pooled loss-of-function studies. These tools are valuable resources for studying miRNA biology and for miRNA-based therapeutics.


Conflict of interest statement

Competing financial interests

The authors declare no competing financial interests.

Figures

Figure 1
Figure 1. Sensor-seq provides a rapid, high-throughput means to assess miRNA activity
(a) Schematic of the Sensor-seq assay. BdLV, bidirectional lentiviral vector. GFP, green fluorescent protein, NGFR, truncated nerve growth factor receptor. (b) Representative FACS plots from sorted THP1 cells. (c) Expression pattern of specific sensors as determined by Sensor-seq. Values are mean ± s.d.; n = 3. The P value was generated from a t-test comparison of GFPneg and NGFR+ bins. (d) Representative FACS plots for individually transduced sensors; n = 3. (e) Comparative analysis of target suppression between monocyte, macrophage (MΦ), and kidney cell lines based on Sensor-seq. miRNA sensors were classified based on significant enrichment (≥2-fold, P < 0.05, t-test) in GFPneg:completely suppressed, GFPneg and GFPlow: strongly suppressed, GFPlow: suppressed, and GFPpos and GFPhigh: Not suppressed.
Figure 2
Figure 2. Correlating miRNA abundance and target suppression
(a) miRNA expression levels in monocytes determined by deep sequencing. Values are the mean reads per million (RPM) ± s.d.; n = 3 shown for all miRNAs over 1 RPM. (b) Fold enrichment in the indicated bin over the total NGFR+ population for each miRNA sensor, as determined by Sensor-seq. Values are mean ± s.d.; n = 3 (c,d) The concentration of each miRNA as a function of whether the its sensor was suppressed or not suppressed in (c) THP1 monocytes and (d) 293T embryonic kidney cells. A sensor was deemed suppressed if the frequency of the sensor was significantly enriched (P<0.05 t-test) by 2-fold or more in GFPneg or GFPlow bins compared to the total NGFR+ population. Ind, individual miRNA. Fam, miRNA family.
Figure 3
Figure 3. miRNAs have different effective concentrations
(a) Mean miRNA abundance as a function of the mean fold enrichment of corresponding PT or BT sensors in the GFPneg bin over the NGFR+ population; n = 3. Note that a sensor not enriched in the GFPneg fraction may still be enriched in the GFPlow fraction, and thus not all the points in this graph that are <2-fold correspond to a non-suppressive miRNA. (b) Ratio of the sum of predicted target transcript abundance to miRNA abundance for sensor library miRNAs in THP1 cells. n = 3. RPKM, average reads per kilobase of exon per million mapped reads. Only miRNAs expressed at >1,000 RPM are shown; miRNAs that were non-suppressive are highlighted. (c) Sensor-seq profiles of miR-16, miR-21 and miR-223 BT sensors in THP1 cells. Sensor frequencies are mean ± s.d.; n = 3. The frequency of each sensor in the total population of transduced cells is highlighted in red. The mean ± s.d. concentration of the corresponding miRNA is in parentheses; n = 3. (d) Representative FACS plots of THP1 monocytes 1 week after transduction with miR-16 or miR-21 BT sensors; n = 3. (e) Percentage of miRNAs in the nucleus relative to the entire cell for THP1 cells determined by quantitative PCR. Values are mean ± s.d.; n = 3.
Figure 4
Figure 4. miRNA decoy library enables pooled loss-of-function screens
(a) Schematic of the approach used to assess miR-122 loss of function. (b) Representative FACS plots showing frequency of GFP-positive cells transduced with miR-122 decoy or control miR-311 decoy at three time points after hepatitis C virus (HCV) infection of Huh-7.5 cells. Note that due to differences in titer the miR-331 transduced cells had a higher vector copy per cell than the miR-122 decoy transduced cells. (c) The frequency of Huh-7.5 cells encoding the miR-122 decoy (GFP+), as determined by FACS, in the presence or absence of HCV infection plotted over time. Values are mean ± s.d.; n = 3 biological replicates. (d) Schematic of the approach used to assess miR-142-3p loss-of-function in a pooled decoy screen. (e) FACS analysis of 142-3p sensor cells transduced at low multiplicity of infection with the decoy vector library. (f) Ratio of mCherryhighGFP+ to mCherry+GFP+ decoy vector frequencies in miR-142-3p sensor cells based on normalized read frequencies from deep sequencing. Representative of two experiments is shown.

References

    1. Landgraf P, et al. A mammalian microRNA expression atlas based on small RNA library sequencing. Cell. 2007;129:1401–1414. - PMC - PubMed
    1. He L, Hannon GJ. MicroRNAs: small RNAs with a big role in gene regulation. Nat Rev Genet. 2004;5:522–531. - PubMed
    1. Bartel DP. MicroRNAs: target recognition and regulatory functions. Cell. 2009;136:215–233. - PMC - PubMed
    1. Brown BD, Naldini L. Exploiting and antagonizing microRNA regulation for therapeutic and experimental applications. Nat Rev Genet. 2009;10:578–585. - PubMed
    1. Mansfield JH, et al. MicroRNA-responsive ‘sensor’ transgenes uncover Hox-like and other developmentally regulated patterns of vertebrate microRNA expression. Nat Genet. 2004;36:1079–1083. - PubMed

Publication types

Associated data