. 2012 Jun;24(6):2328-51.
doi: 10.1105/tpc.112.099002. Epub 2012 Jun 29.

Antisense inhibition of the 2-oxoglutarate dehydrogenase complex in tomato demonstrates its importance for plant respiration and during leaf senescence and fruit maturation

Affiliations

Antisense inhibition of the 2-oxoglutarate dehydrogenase complex in tomato demonstrates its importance for plant respiration and during leaf senescence and fruit maturation

Wagner L Araújo et al. Plant Cell. 2012 Jun.

Abstract

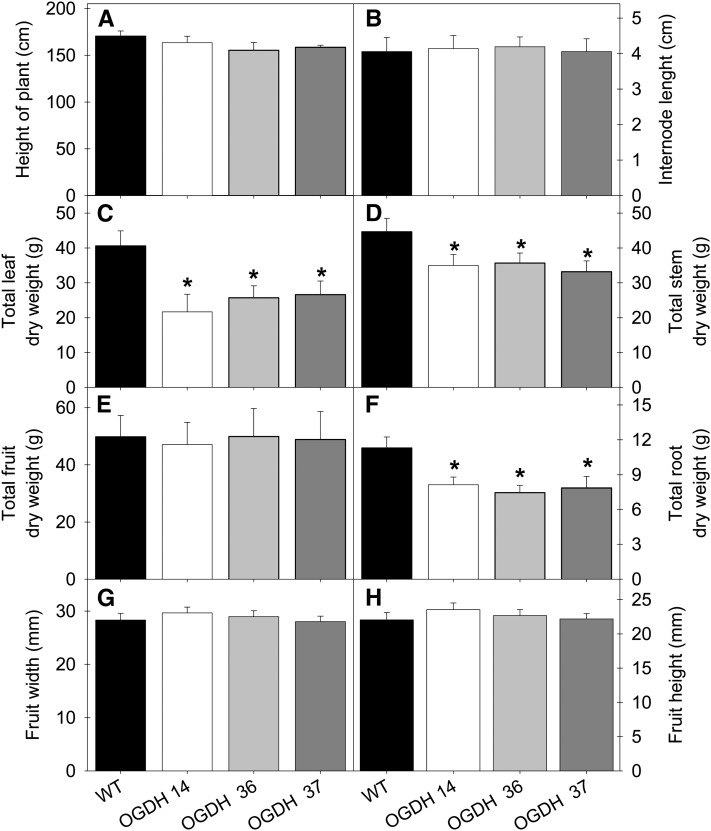
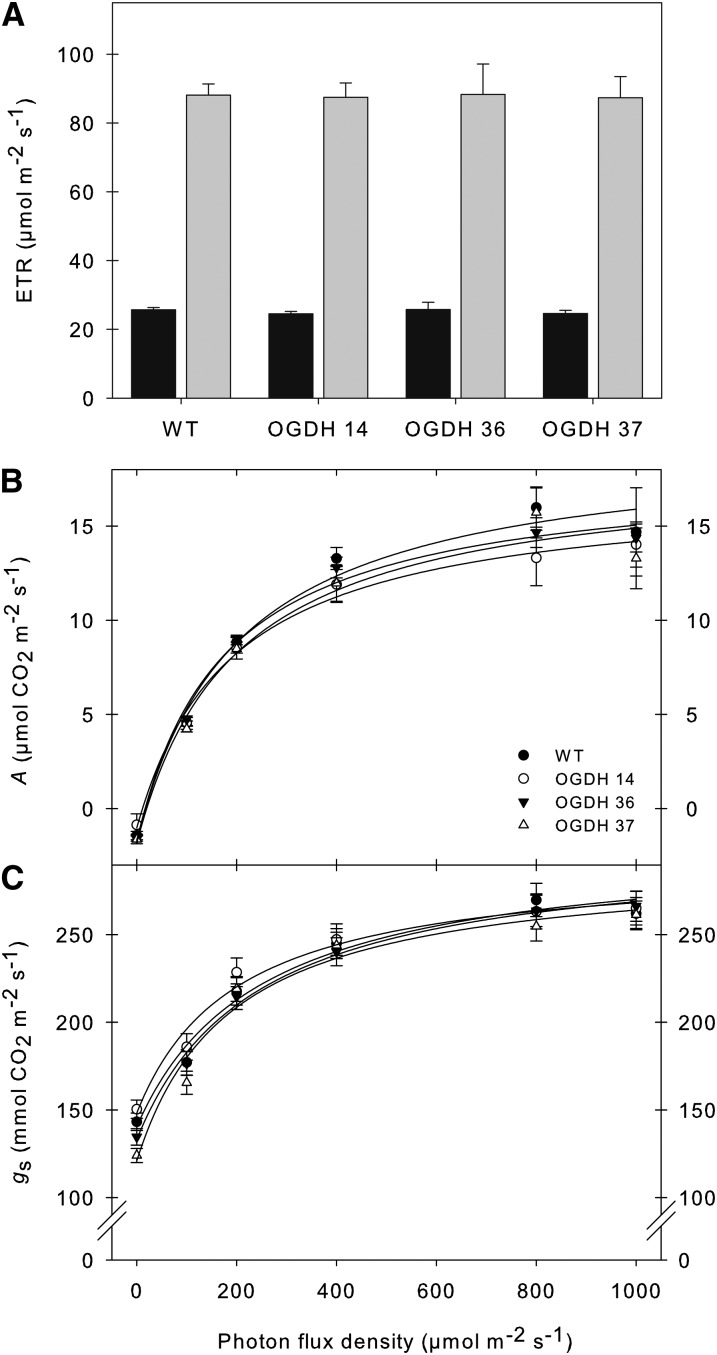
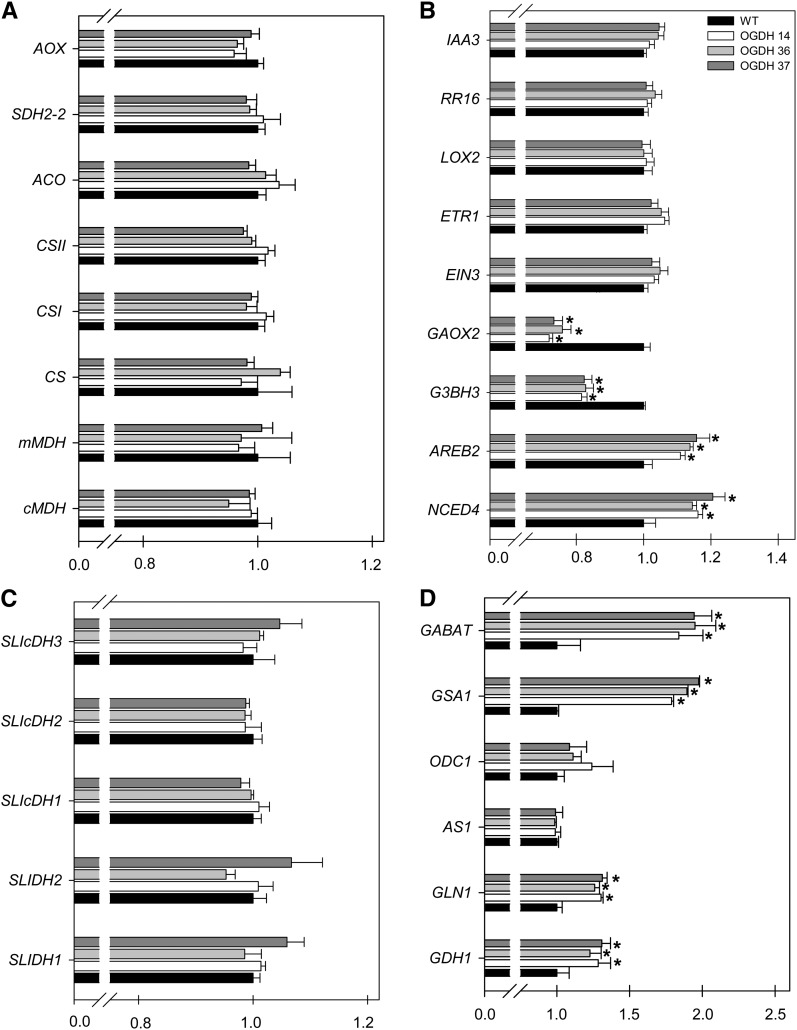
Transgenic tomato (Solanum lycopersicum) plants expressing a fragment of the gene encoding the E1 subunit of the 2-oxoglutarate dehydrogenase complex in the antisense orientation and exhibiting substantial reductions in the activity of this enzyme exhibit a considerably reduced rate of respiration. They were, however, characterized by largely unaltered photosynthetic rates and fruit yields but restricted leaf, stem, and root growth. These lines displayed markedly altered metabolic profiles, including changes in tricarboxylic acid cycle intermediates and in the majority of the amino acids but unaltered pyridine nucleotide content both in leaves and during the progression of fruit ripening. Moreover, they displayed a generally accelerated development exhibiting early flowering, accelerated fruit ripening, and a markedly earlier onset of leaf senescence. In addition, transcript and selective hormone profiling of gibberellins and abscisic acid revealed changes only in the former coupled to changes in transcripts encoding enzymes of gibberellin biosynthesis. The data obtained are discussed in the context of the importance of this enzyme in both photosynthetic and respiratory metabolism as well as in programs of plant development connected to carbon-nitrogen interactions.


Figures

Figure 1.
Figure 1.
Characterization and Expression of Tomato OGDH. OGDH activity was determined in fruits at 35 DAA (A) and in 4-week-old leaves (B) of tomato plants. ODGH E1 (C) and OGDH E2 (D) expression was determined in leaves of 4-week-old plants. The abundance of OGDH mRNAs was measured by quantitative RT-PCR. Values are presented as means ± se of six individual plants per line. Asterisks indicate values that were determined by Student’s t test to be significantly different from the wild type (WT; P < 0.05). FW, Fresh weight.
Figure 2.
Figure 2.
Early-Flowering Phenotype of Antisense OGDH Tomato Plants. (A) Cumulative number of flowers determined after the first flower was observed. (B) Number of days needed for tomato plants to start to flower, determined as days after planting until the first flower appears. (C) Total number of flowers per plant determined in 10-week-old plants. Similar results were observed in three independent experiments. Values are presented as means ± se of determinations on at least six individual plants per line. Asterisks indicate values that were determined by Student’s t test to be significantly different (P < 0.05) from the wild type (WT).
Figure 3.
Figure 3.
Growth Phenotype of Antisense OGDH Tomato Plants. Transgenic plants showed early flowering (A), early senescence (B), and early fruit ripening (C) with respect to the wild type (WT). Representative plants after 5 and 8 weeks of growth as well as branches with fruits of a similar age are shown.
Figure 4.
Figure 4.
Growth Phenotype of Antisense OGDH Tomato Plants. Transgenic plants showed an enhanced aerial biomass with respect to the wild type (WT) in the later stages of growth (10-week-old plants). Data shown are for plant height (A), internode length (B), total leaf dry weight (C), total stem dry weight (D), total fruit dry weight (E), total root dry weight (F), mean fruit width (G), and mean fruit height (H). The lines used were as follows: the wild type, black bars; OGDH14, white bars; OGDH36, light gray bars; OGDH37, dark gray bars. Values are presented as means ± se of six individual plants per line. Asterisks indicate values that were determined by Student’s t test to be significantly different (P < 0.05) from the wild type.
Figure 5.
Figure 5.
Respiratory Parameters in Leaves of Antisense OGDH Tomato Plants. (A) Dark respiration (Rd) measurements performed in 4-week-old plants. (B) Evolution of 14CO2 from isolated leaf discs in the light. The leaf discs were taken from 4-week-old plants and incubated in 10 mM MES-KOH solution, pH 6.5, and 0.3 mM Glc supplemented with 2.32 kBq mL−1 [1-14C]Glc, [2-14C]Glc, [3,4-14C]Glc, or [6-14C]Glc at an irradiance of 200 μmol m−2 s−1. The 14CO2 liberated was captured (at hourly intervals) in a KOH trap, and the amount of radiolabel released was subsequently quantified by liquid scintillation counting. Values are presented as means ± se of determinations on six individual plants per line. Asterisks indicate values that were determined by Student’s t test to be significantly different (P < 0.05) from the wild type (WT).
Figure 6.
Figure 6.
Effect of Decreased OGDH Activity on Photosynthetic Parameters. (A) In vivo chlorophyll a fluorescence was measured as an indicator of the ETR by use of a PAM fluorometer at PFDs of 100 (black bars) and 700 (gray bars) μmol m−2 s−1. (B) Assimilation rate as a function of PFD. (C) Stomatal conductance as a function of PFD. Values are presented as means ± se of six individual determinations per line. All measurements were performed in 4- to 5-week-old plants. The lines used were as follows: the wild type (WT), black circles; OGDH14, white circles; OGDH36, black triangles; OGDH37, white triangles.
Figure 7.
Figure 7.
Relative Metabolite Content of Fully Expanded Leaves from 4-Week-Old Antisense OGDH Plants. Amino acids (A) and organic acids (B) were determined as described in Methods. The full data sets from these metabolic profiling studies are available in Supplemental Table 1 online. Data are normalized with respect to the mean response calculated for the wild type (WT); to allow statistical assessment, individual plants from this set were normalized in the same way. The lines used were as follows: the wild type, black bars; OGDH14, white bars; OGDH36, light gray bars; OGDH37, dark gray bars. Values are presented as means ± se of six individual plants per line. Asterisks indicate values that were determined by Student’s t test to be significantly different (P < 0.05) from the wild type.
Figure 8.
Figure 8.
Metabolite Levels in Leaves of OGDH Transgenic Tomato Plants. Total amino acid (A), protein (B), nitrate (C), starch (D), malate (E), fumarate (F), Suc (G), Glc (H), and Fru (I) levels were measured using leaf material harvested in the middle of the light period from 4-week-old plants. Values are means ± se of six independent samplings. The lines used were as follows: the wild type (WT), black bars; OGDH14, white bars; OGDH36, light gray bars; OGDH37, dark gray bars. Asterisks indicate values that were determined by Student’s t test to be significantly different (P < 0.05) from the wild-type. FW, Fresh weight.
Figure 9.
Figure 9.
Pyridine Nucleotide Levels and Ratios in Leaves of OGDH Transgenic Tomato Plants. The leaf material was harvested in the middle of the light period from 4-week-old plants. Values are means ± se of six independent samplings. The lines used were as follows: the wild type (WT), black bars; OGDH14, white bars; OGDH36, light gray bars; OGDH37, dark gray bars. Asterisks indicate values that were determined by Student’s t test to be significantly different (P < 0.05) from the wild-type. FW, Fresh weight.
Figure 10.
Figure 10.
Transcript Responses Involved in Regulatory and/or Signaling Responses in Plant Growth and Development. Relative transcript abundance is shown for mitochondrion-related genes (A), hormone-related genes (B), various cellular isoforms of isocitrate dehydrogenase (C), and GABA shunt– and amino acid–related genes (D). The transcripts analyzed here were as follows: alternative oxidase (AOX), iron–sulfur subunit of succinate dehydrogenase (SDH2-2), aconitase hydratase (ACO), peroxisomal isoforms of citrate synthase (CSI and CSII), mitochondrial isoform of citrate synthase (CS), mitochondrial NAD-dependent malate dehydrogenase (mMDH), cytosolic malate dehydrogenase (cMDH), indole-3-acetic acid induced–related protein (IAA3), response regulator 16 (cytokinin, signal transduction; RR16), lipoxygenase 2 (LOX2), ethylene response 1 (ETR1), ethylene-insensitive 3 protein (EIN3), gibberellin 2-oxidase 4 (GAOX2), gibberellin 3β-hydroxylase 3 (G3BH3), ABA-responsive element binding protein 2 (AREB2), 9-cis-epoxycarotenoid dioxygenase (NCED4), most likely mitochondrial NADP-ICDH (SlICDH3), most likely cytosolic NADP-ICDH (SlICDH2), cytosolic NADP-ICDH (SlICDH1), mitochondrial regulatory NAD-IDH (SIIDH2), mitochondrial regulatory NAD-IDH (SIIDH1), γ-aminobutyrate transaminase (GABAT), glutamate-1-semialdehyde 2,1-aminomutase (GSA1), ornithine decarboxylase (ODC1), asparagine synthetase 1 (AS1), glutamine synthetase 1 (GLN1), and glutamate dehydrogenase (GDH1). Analyses were done in fully expanded leaves of 4-week-old plants. Values are presented as means ± se of six individual plants. The lines used were as follows: the wild type (WT), black bars; OGDH14, white bars; OGDH36, light gray bars; OGDH37, dark gray bars. Asterisks indicate values that were determined by Student’s t test to be significantly different (P < 0.05) from the wild type.
Figure 11.
Figure 11.
Hormone Contents of the Wild-Type and Tomato OGDH Antisense Lines. Data shown are GA1 (A), GA3 (B), GA7 (C), and ABA (D) contents of wild-type (WT) and OGDH antisense lines. Values are presented as means ± se of six individual determinations per line. All measurements were performed in 4-week-old plants. The lines used were as follows: the wild type, black bars; OGDH14, white bars; OGDH36, light gray bars; OGDH37, dark gray bars. Asterisks indicate values that were determined by Student’s t test to be significantly different (P < 0.05) from the wild type. FW, Fresh weight.

Similar articles

Cited by

References

    1. Aharoni N., Richmond A.E. (1978). Endogenous gibberellin and abscisic acid content as related to senescence of detached lettuce leaves. Plant Physiol. 62: 224–228 - PMC - PubMed
    1. ap Rees T.A., Beevers H. (1960). Pathways of glucose dissimilation in carrot slices. Plant Physiol. 35: 830–838 - PMC - PubMed
    1. Araújo W.L., Ishizaki K., Nunes-Nesi A., Larson T.R., Tohge T., Krahnert I., Witt S., Obata T., Schauer N., Graham I.A., Leaver C.J., Fernie A.R. (2010). Identification of the 2-hydroxyglutarate and isovaleryl-CoA dehydrogenases as alternative electron donors linking lysine catabolism to the electron transport chain of Arabidopsis mitochondria. Plant Cell 22: 1549–1563 - PMC - PubMed
    1. Araújo W.L., Ishizaki K., Nunes-Nesi A., Tohge T., Larson T.R., Krahnert I., Balbo I., Witt S., Dörmann P., Graham I.A., Leaver C.J., Fernie A.R. (2011b). Analysis of a range of catabolic mutants provides evidence that phytanoyl-coenzyme A does not act as a substrate of the electron-transfer flavoprotein/electron-transfer flavoprotein:ubiquinone oxidoreductase complex in Arabidopsis during dark-induced senescence. Plant Physiol. 157: 55–69 - PMC - PubMed
    1. Araújo W.L., Nunes-Nesi A., Nikoloski Z., Sweetlove L.J., Fernie A.R. (2012). Metabolic control and regulation of the tricarboxylic acid cycle in photosynthetic and heterotrophic plant tissues. Plant Cell Environ. 35: 1–21 - PubMed

Publication types

MeSH terms