

Plant cell division: ROS homeostasis is required
- PMID: 22751303
- PMCID: PMC3583961
- DOI: 10.4161/psb.20530
Plant cell division: ROS homeostasis is required
Abstract
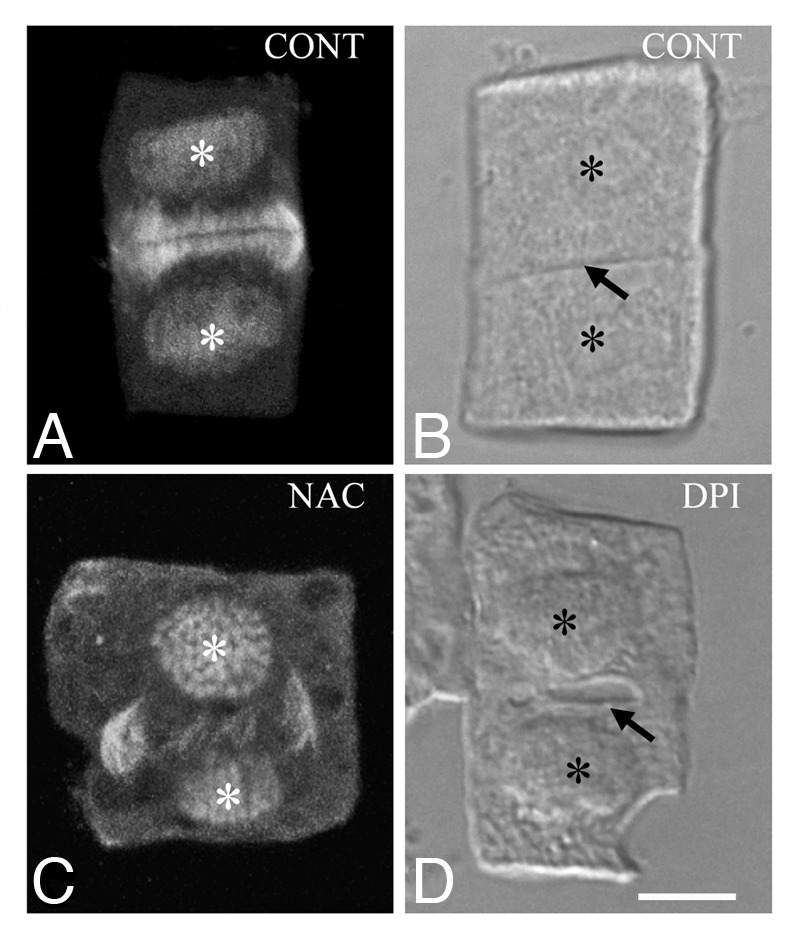
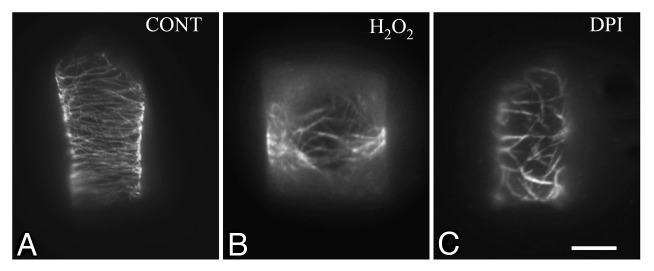
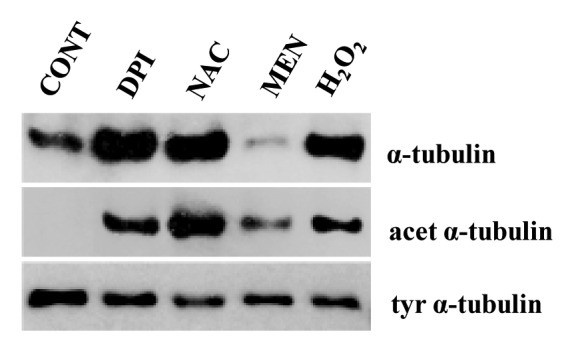
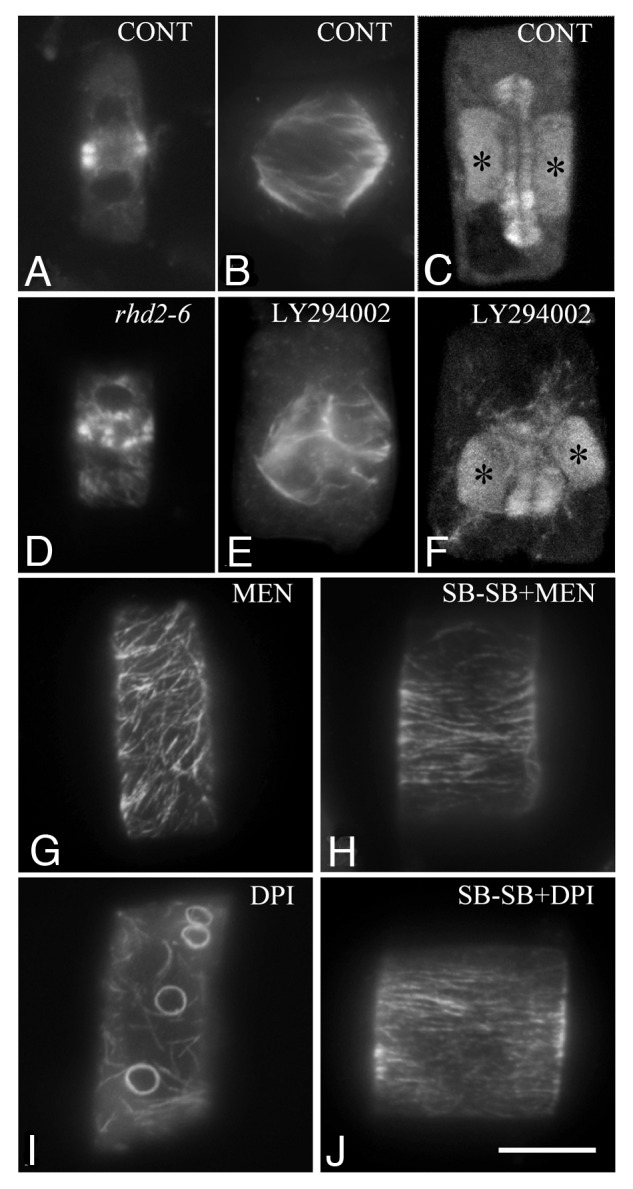
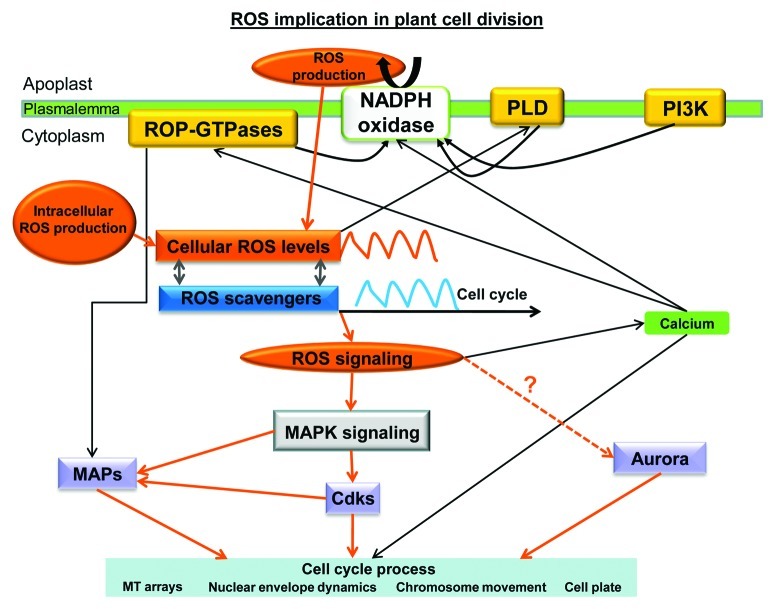
Accumulated evidence indicates that ROS fluctuations play a critical role in cell division. Dividing plant cells rapidly respond to them. Experimental disturbance of ROS homeostasis affects: tubulin polymerization; PPB, mitotic spindle and phragmoplast assembly; nuclear envelope dynamics; chromosome separation and movement; cell plate formation. Dividing cells mainly accumulate at prophase and delay in passing through the successive cell division stages. Notably, many dividing root cells of the rhd2 Arabidopsis thaliana mutants, lacking the RHD2/AtRBOHC protein function, displayed aberrations, comparable to those induced by low ROS levels. Some protein molecules, playing key roles in signal transduction networks inducing ROS production, participate in cell division. NADPH oxidases and their regulators PLD, PI3K and ROP-GTPases, are involved in MT polymerization and organization. Cellular ROS oscillations function as messages rapidly transmitted through MAPK pathways inducing MAP activation, thus affecting MT dynamics and organization. RNS implication in cell division is also considered.
Figures
Similar articles
-
Disturbance of reactive oxygen species homeostasis induces atypical tubulin polymer formation and affects mitosis in root-tip cells of Triticum turgidum and Arabidopsis thaliana.Cytoskeleton (Hoboken). 2012 Jan;69(1):1-21. doi: 10.1002/cm.20538. Epub 2011 Oct 18. Cytoskeleton (Hoboken). 2012. PMID: 21976360
-
Phosphorylation of a p38-like MAPK is involved in sensing cellular redox state and drives atypical tubulin polymer assembly in angiosperms.Plant Cell Environ. 2014 May;37(5):1130-43. doi: 10.1111/pce.12222. Epub 2013 Nov 19. Plant Cell Environ. 2014. PMID: 24138172
-
NADPH oxidase-dependent reactive oxygen species formation required for root hair growth depends on ROP GTPase.J Exp Bot. 2007;58(6):1261-70. doi: 10.1093/jxb/erl279. Epub 2007 Feb 14. J Exp Bot. 2007. PMID: 17301029
-
Microtubule nucleation for the assembly of acentrosomal microtubule arrays in plant cells.New Phytol. 2019 Jun;222(4):1705-1718. doi: 10.1111/nph.15705. Epub 2019 Feb 25. New Phytol. 2019. PMID: 30681146 Review.
-
Reactive oxygen species in plant development.Development. 2018 Aug 9;145(15):dev164376. doi: 10.1242/dev.164376. Development. 2018. PMID: 30093413 Review.
Cited by
-
The localization of NADPH oxidase and reactive oxygen species in in vitro-cultured Mesembryanthemum crystallinum L. hypocotyls discloses their differing roles in rhizogenesis.Protoplasma. 2015 Mar;252(2):477-87. doi: 10.1007/s00709-014-0692-2. Epub 2014 Aug 30. Protoplasma. 2015. PMID: 25172434 Free PMC article.
-
Deliberate ROS production and auxin synergistically trigger the asymmetrical division generating the subsidiary cells in Zea mays stomatal complexes.Protoplasma. 2016 Jul;253(4):1081-99. doi: 10.1007/s00709-015-0866-6. Epub 2015 Aug 7. Protoplasma. 2016. PMID: 26250135
-
Determination of malathion's toxic effect on Lens culinaris Medik cell cycle.Heliyon. 2020 Sep 6;6(9):e04846. doi: 10.1016/j.heliyon.2020.e04846. eCollection 2020 Sep. Heliyon. 2020. PMID: 32954032 Free PMC article.
-
Genome-Wide Analysis of the Phospholipase D Family in Five Cotton Species, and Potential Role of GhPLD2 in Fiber Development and Anther Dehiscence.Front Plant Sci. 2021 Oct 1;12:728025. doi: 10.3389/fpls.2021.728025. eCollection 2021. Front Plant Sci. 2021. PMID: 34659294 Free PMC article.
-
Transcriptional control of hydrogen peroxide homeostasis regulates ground tissue patterning in the Arabidopsis root.Front Plant Sci. 2023 Aug 21;14:1242211. doi: 10.3389/fpls.2023.1242211. eCollection 2023. Front Plant Sci. 2023. PMID: 37670865 Free PMC article.
References
Publication types
MeSH terms
Substances
LinkOut - more resources
Full Text Sources
Other Literature Sources
Molecular Biology Databases