. 2012 Jul;7(7):847-55.
doi: 10.4161/psb.20385. Epub 2012 Jul 1.

Comprehensive expression analysis of rice phospholipase D gene family during abiotic stresses and development

Affiliations

Comprehensive expression analysis of rice phospholipase D gene family during abiotic stresses and development

Amarjeet Singh et al. Plant Signal Behav. 2012 Jul.

Abstract

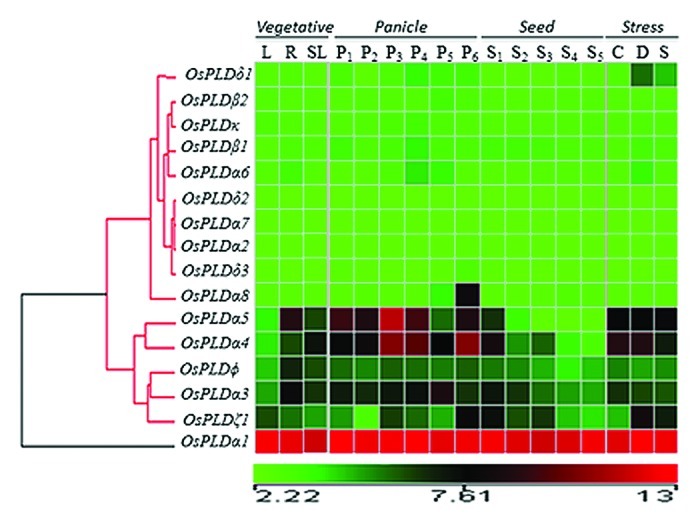
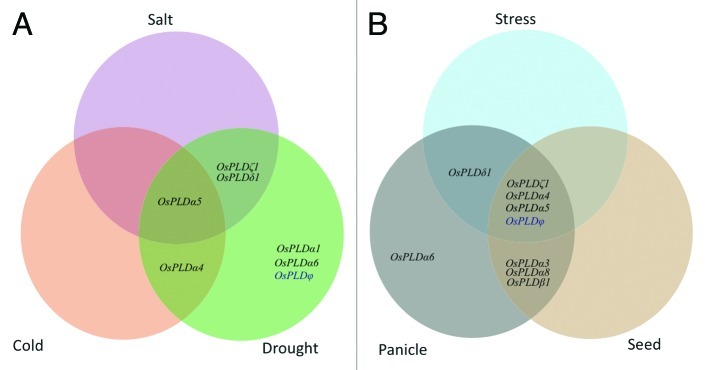
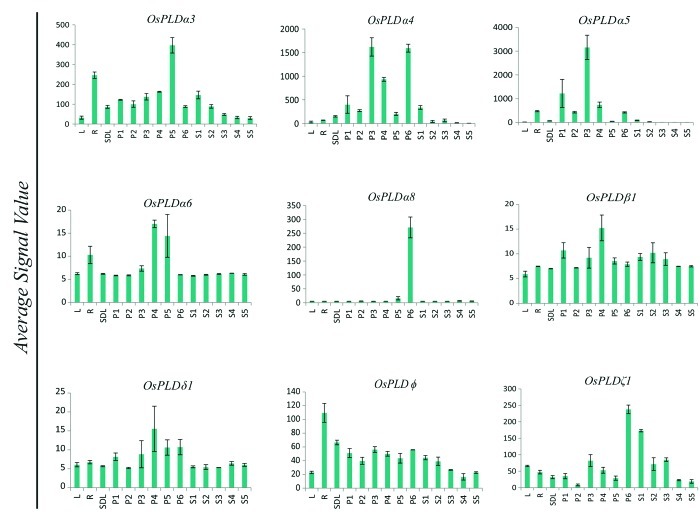
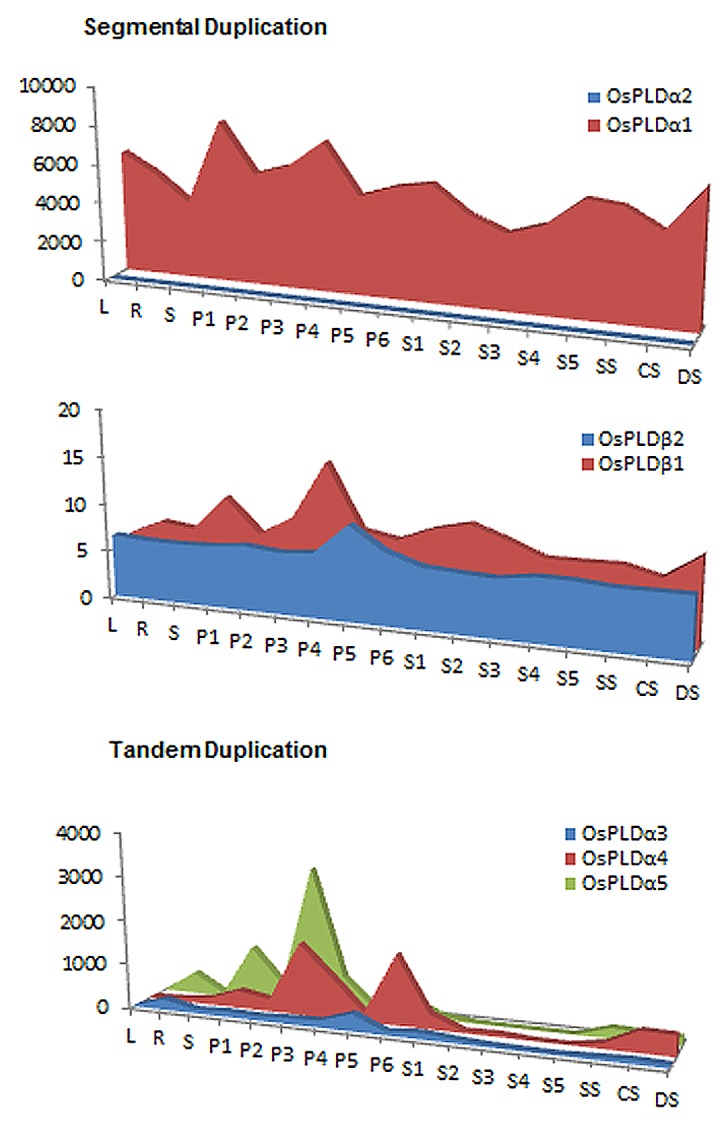
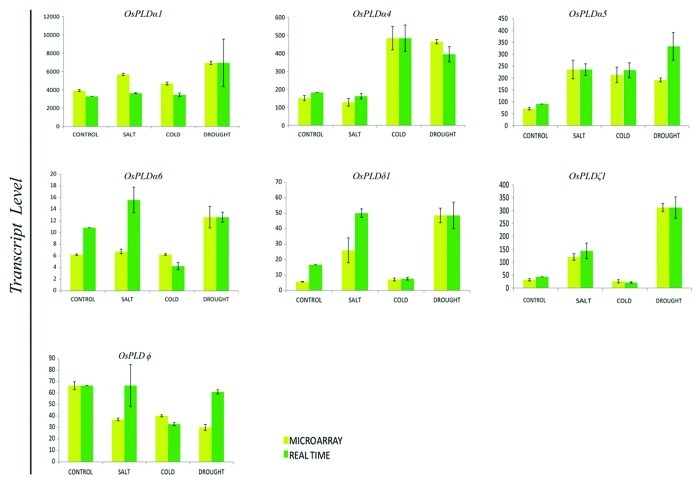
Phospholipase D is one of the crucial enzymes involved in lipid mediated signaling, triggered during various developmental and physiological processes. Different members of PLD gene family have been known to be induced under different abiotic stresses and during developmental processes in various plant species. In this report, we are presenting a detailed microarray based expression analysis and expression profiles of entire set of PLD genes in rice genome, under three abiotic stresses (salt, cold and drought) and different developmental stages (3-vegetative stages and 11-reproductive stages). Seven and nine PLD genes were identified, which were expressed differentially under abiotic stresses and during reproductive developmental stages, respectively. PLD genes, which were expressed significantly under abiotic stresses exhibited an overlapping expression pattern and were also differentially expressed during developmental stages. Moreover, expression pattern for a set of stress induced genes was validated by real time PCR and it supported the microarray expression data. These findings emphasize the role of PLDs in abiotic stress signaling and development in rice. In addition, expression profiling for duplicated PLD genes revealed a functional divergence between the duplicated genes and signify the role of gene duplication in the evolution of this gene family in rice. This expressional study will provide an important platform in future for the functional characterization of PLDs in crop plants.


Figures

None
Figure 1. Expression of rice PLD gene family has been represented by a heat map. Developmental stages comprising three vegetative stages (L-leaf, R-root and SL-7­d­old seedling), six stages of panicle [P1 (0–3 cm), P2 (3–5 cm), P3 (5–10 cm), P4 (10–15 cm), P5 (15–22 cm), and P6 (22–30 cm)] and five stages of seed [S1 (0–2 DAP), S2 (3–4 DAP), S3 (4–10 DAP), S4 (11–20 DAP) and S5 (21–29 DAP)]. Clustering of the expression profile was done with log transformed average values taking mature leaf as base line. Three stress conditions are denoted as C, Cold Stress; D, Drought Stress; S, Salt Stress and SL, control, seven day old unstressed seedling. The scale at the bottom of each heat map is given in log2 intensity value.
None
Figure 3. Venn diagram for differentially expressed PLDs. PLD genes up- and downregulated (A) under different abiotic stress conditions and (B) under stresses and developmental stages. Different compartments showing genes specific to either a particular stress/developmental stage or common to more than one stress and/or developmental stage.
None
Figure 2. Expression profiles of differentially expressed PLD genes during developmental stages. Average signal intensity value of three replicates from microarray for all the developmental stages has been plotted to show the differential expression. Standard error bars have been shown. Y-axis represents signal values from microarray and X-axis shows different developmental stages.
None
Figure 4. Expression profiles of duplicated PLD genes. Expression profiles of segmentally and tandemly duplicated gene pairs/clusters from microarray data were compared in various developmental stages including leaf (L), root (R) and seven day old seedling (S) tissue, in various stages of panicle development (P1-P6), seed development (S1-S5) and under cold stress (CS), dehydration stress (DS) and salt stress (SS). Each area graph represents compilation of the mean normalized signal intensity values.
None
Figure 5. Validation of microarray expression profiles for differentially expressing PLD genes by quantitative RT-PCR. Two and three biological replicates were analyzed by real time PCR and microarray, respectively. Standard error bars have been shown for both microarray and real time PCR data. Y-axis represents raw expression values from microarray and normalized expression value from real time PCR and X-axis shows different experimental conditions.

Similar articles

Cited by

References

    1. Munnik T, Meijer HJ. Osmotic stress activates distinct lipid and MAPK signalling pathways in plants. FEBS Lett. 2001;498:172–8. doi: 10.1016/S0014-5793(01)02492-9. - DOI - PubMed
    1. Zhu JK. Salt and drought stress signal transduction in plants. Annu Rev Plant Biol. 2002;53:247–73. doi: 10.1146/annurev.arplant.53.091401.143329. - DOI - PMC - PubMed
    1. Xiong L, Schumaker KS, Zhu JK. Cell signaling during cold, drought, and salt stress. Plant Cell. 2002;14(Suppl):S165–83. - PMC - PubMed
    1. Yamaguchi-Shinozaki K, Shinozaki K. Transcriptional regulatory networks in cellular responses and tolerance to dehydration and cold stresses. Annu Rev Plant Biol. 2006;57:781–803. doi: 10.1146/annurev.arplant.57.032905.105444. - DOI - PubMed
    1. Hong Y, Pan X, Welti R, Wang X. Phospholipase Dalpha3 is involved in the hyperosmotic response in Arabidopsis. Plant Cell. 2008;20:803–16. doi: 10.1105/tpc.107.056390. - DOI - PMC - PubMed

Publication types

MeSH terms

LinkOut - more resources