. 2012 Jun;8(6):938-53.
doi: 10.4161/auto.19781. Epub 2012 Jun 1.

The role of autophagy during coxsackievirus infection of neural progenitor and stem cells

Affiliations

The role of autophagy during coxsackievirus infection of neural progenitor and stem cells

Jenna M Tabor-Godwin et al. Autophagy. 2012 Jun.

Abstract

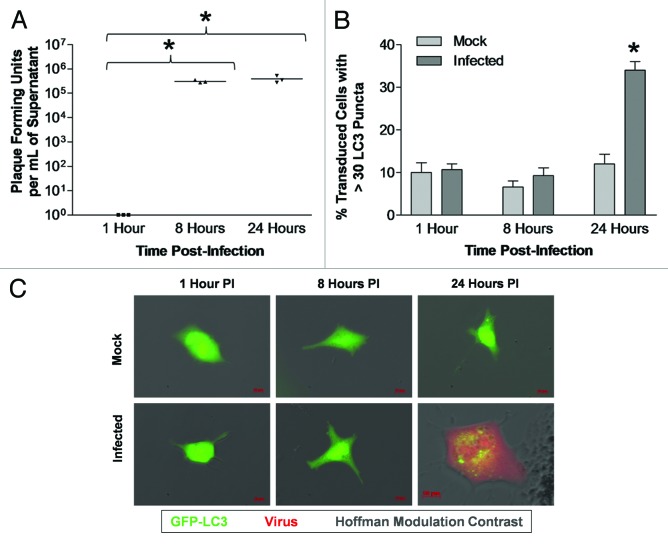
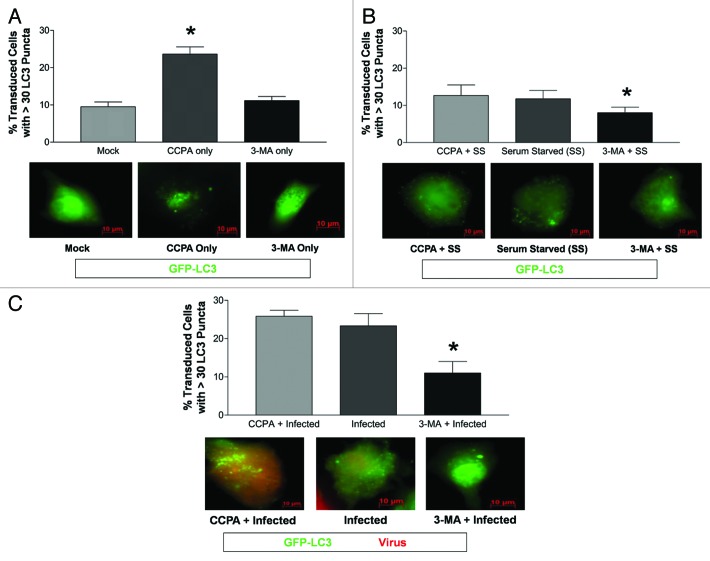
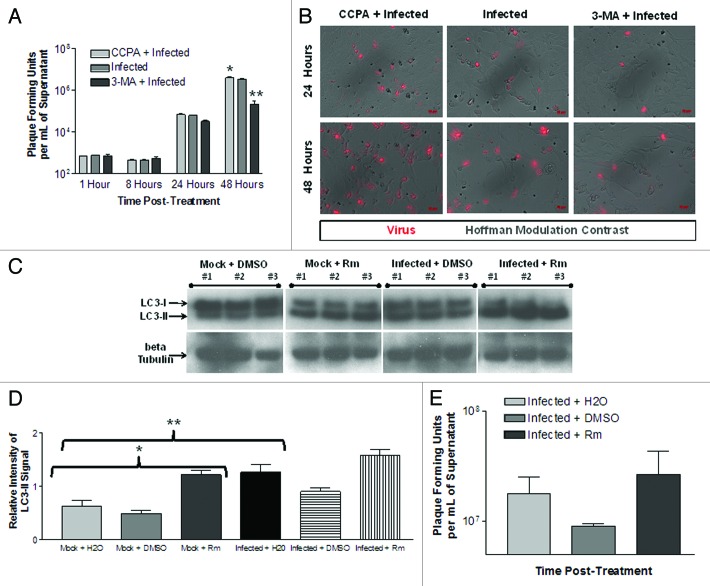
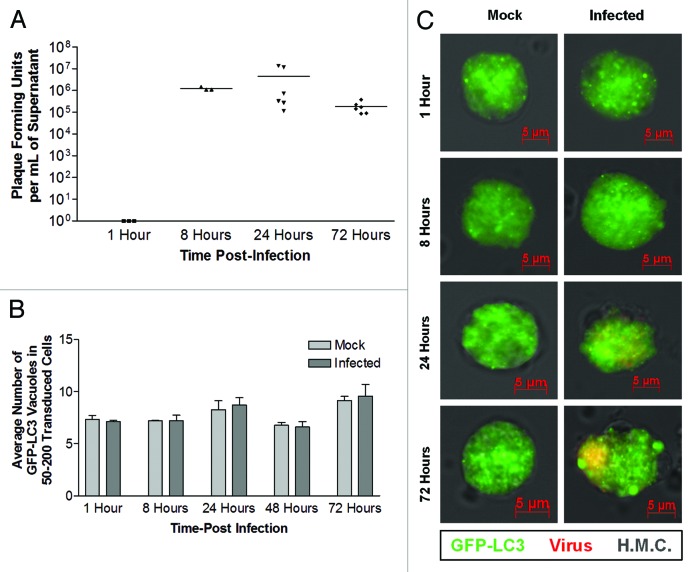
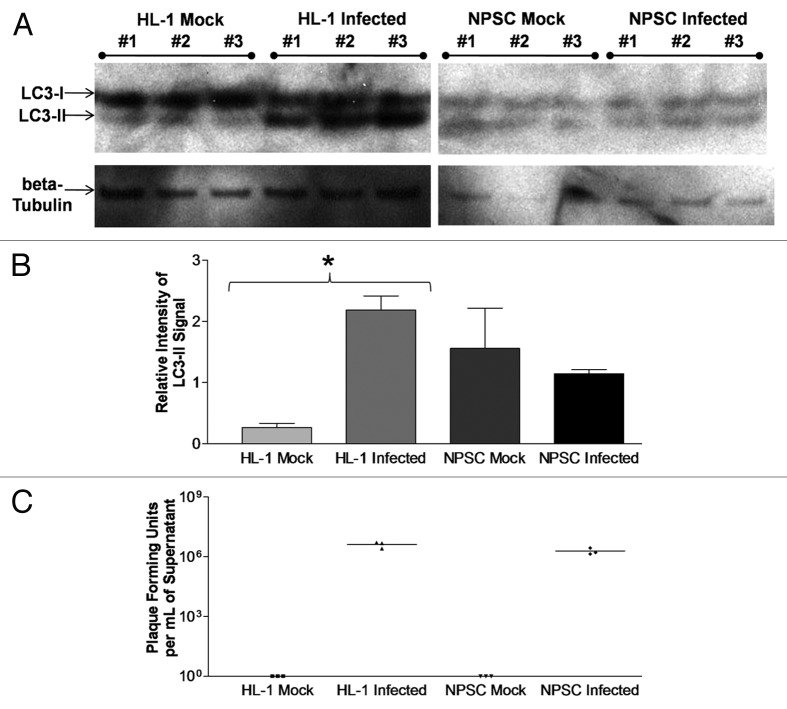
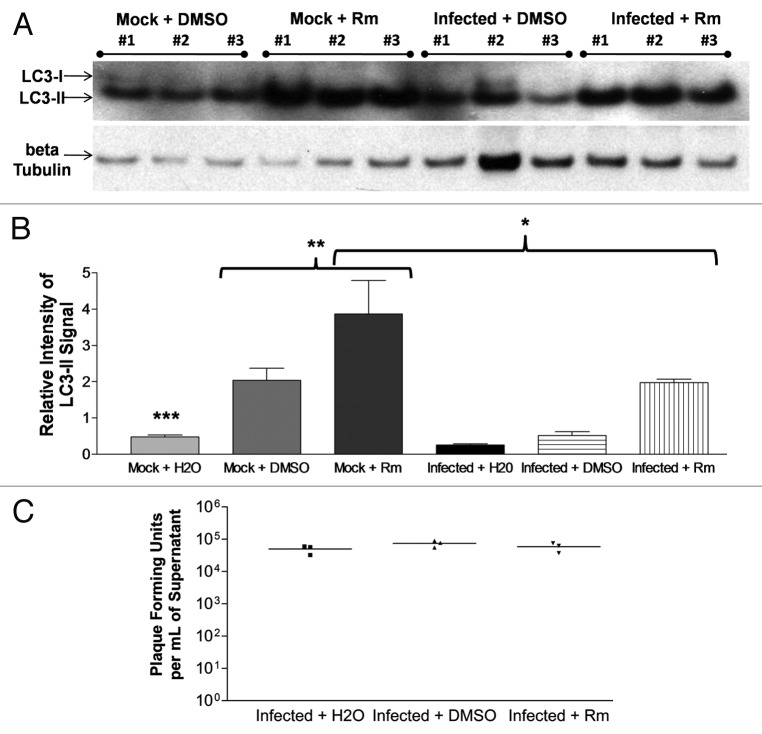
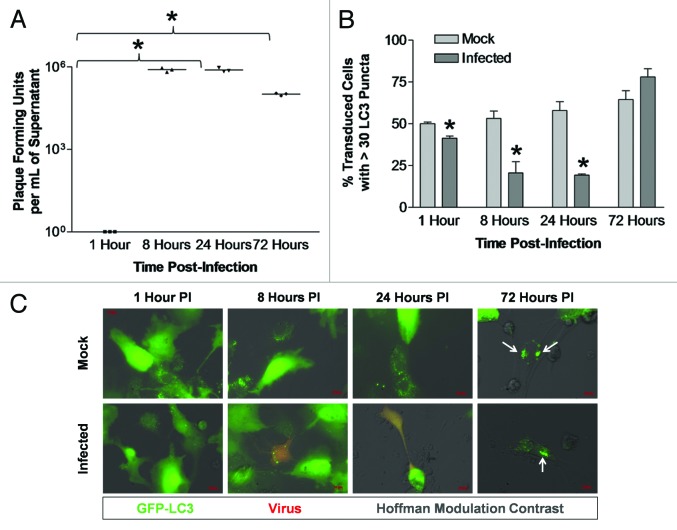
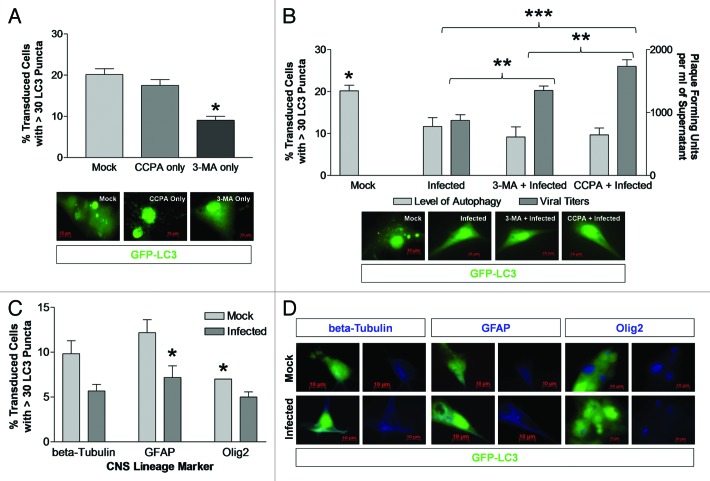
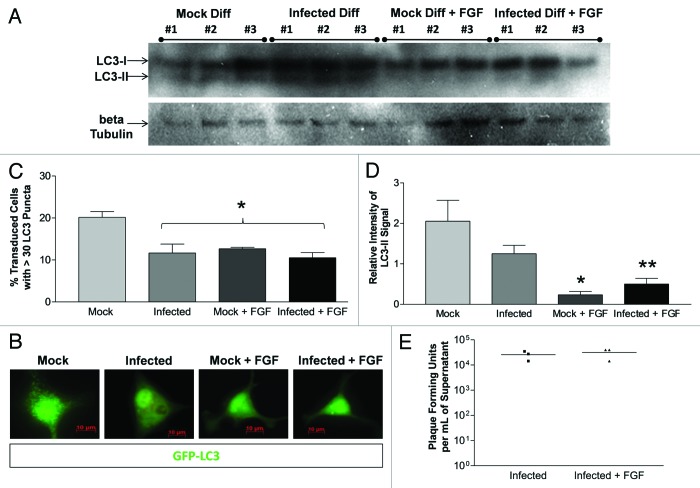
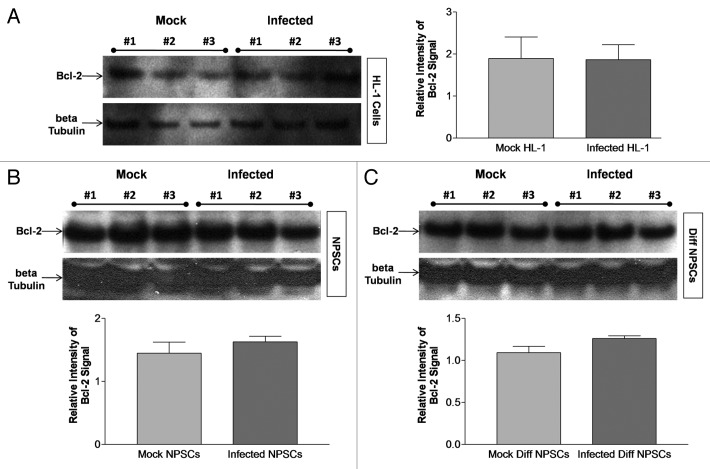
Coxsackievirus B3 (CVB3) has previously been shown to utilize autophagy in an advantageous manner during the course of infection of the host cell. However, few studies have determined whether stem cells induce autophagy in a similar fashion, and whether virus-induced autophagy occurs following infection of stem cells. Therefore, we compared the induction of autophagy following CVB3 infection of neural progenitor and stem cells (NPSCs), which we have recently shown to be highly susceptible to CVB3 infection, to HL-1 cells, a transformed cardiomyocyte cell line. As previously demonstrated for other susceptible host cells, HL-1 cells showed an increase in the activity of autophagic signaling following infection with a CVB3 expressing dsRed protein (dsRed-CVB3). Furthermore, viral titers in HL-1 cells increased in the presence of an inducer of autophagy (CCPA), while viral titers decreased in the presence of an inhibitor of autophagy (3-MA). In contrast, no change in autophagic signaling was seen in NPSCs following infection with dsRed-CVB3. Also, basal levels of autophagy in NPSCs were found to be highly elevated in comparison to HL-1 cells. Autophagy could be induced in NPSCs in the presence of rapamycin without altering levels of dsRed-CVB3 replication. In differentiated NPSC precursors, autophagy was activated during the differentiation process, and a decrease in autophagic signaling was observed within all three CNS lineages following dsRed-CVB3 infection. Hence, we conclude that the role of autophagy in modulating CVB3 replication appears cell type-specific, and stem cells may uniquely regulate autophagy in response to infection.


Figures

None
Figure 1. Activation of autophagic signaling following CVB3 infection in HL-1 cells transduced with Adeno-GFP-LC3. LC3 puncta formation increased following CVB3 infection in HL-1 cells transduced with Adeno-GFP-LC3. HL-1 cells were plated on gelatin/fibronectin-coated chamber slides, transduced with Adeno-GFP-LC3, infected with dsRed-CVB3, and observed by fluorescence microscopy at 63X at the indicated time points. (A) CVB3 titers over time were determined by plaque assay. No viral titers were found in mock-infected cells. Viral titers at 8 h and 24 h PI were significantly higher (*p < 0.01) than 1 h PI (with the initial inoculum subtracted) as determined by ANOVA with Newman-Keuls post-hoc analysis. (B) Quantification of cells with high levels of GFP-LC3 autophagosome vacuoles was performed by counting 50 transduced cells per well, with three wells per treatment (represented as the mean +SEM). High levels of GFP-LC3 autophagosome vacuoles were defined as greater than 30 punctate per cell. Infected cells showed a significant increase in LC3 puncta formation (*p = 0.002), as compared with mock-infected cells at 24 h PI (determined by Student’s t-test). No difference was observed between mock and infected cells at 1 h and 8 h PI. (C) Representative 63X fluorescent images are shown for each time point and treatment.
None
Figure 2. CVB3 infection and CCPA increased the level of LC3 puncta formation in HL-1 cells. (A) The level of autophagy increased (*p < 0.01) following the addition of CCPA (inducer of autophagy) to HL-1 cells, as compared with mock or 3-MA (inhibitor of autophagy). (B) A significant decrease (*p < 0.05) in the percentage of transduced HL-1 cells with high levels of GFP-LC3 vacuoles was observed after serum starvation (SS) in the presence of 3-MA, as compared with serum starvation alone or serum starvation in the presence of CCPA. (C) A significant decrease (*p < 0.01) in the percent of transduced HL-1 cells with high levels of GFP-LC3 vacuoles was observed after dsRed-CVB3 infection in the presence of 3-MA, as compared with dsRed-CVB3 infection alone or in the presence of CCPA. ANOVA with Newman-Keuls post-hoc analysis was utilized to determine statistical significance for each experiment.
None
Figure 3. The induction or inhibition of autophagy altered CVB3 replication and viral protein expression levels in HL-1 cells. HL-1 cells were infected with dsRed-CVB3 and overlaid with fresh media containing CCPA, 3-MA, rapamycin (Rm) or sterile water (vehicle control). Autophagy inducers (CCPA and Rm) or inhibitor (3-MA) were administered in fresh media at the time of dsRed-CVB3 infection at the following final concentrations: CCPA, 0.1 μM; Rm, 5 μM; and 3-MA, 10 mM. (A) Supernatant samples from infected cultures were taken at the indicated time points, and plaque assay was performed to determine viral titers. At 48 h post-treatment, viral titers in 3-MA-treated HL-1 cells were significantly lower (**p < 0.001) than in untreated cultures. In contrast, viral titers in CCPA-treated HL-1 cells were significantly higher (*p < 0.01) than in untreated cultures. A similar trend, although not statistically significant, was observed at 24 h post-treatment. ANOVA with Newman-Keuls post-hoc analysis was utilized to determine statistical significance. (B) Representative fluorescent images of dsRed-CVB3-infected HL-1 cells showing reduced viral protein expression levels in 3-MA-treated HL-1 cells and increased levels in CCPA-treated HL-1 cells at 24 h and 48 h post-treatment. (C) HL-1 cells were treated with H2O, dimethyl sulfoxide (DMSO, vehicle control) or DMSO + rapamycin (Rm) for 24 h. Protein extracts from lysed cells were analyzed for LC3-II levels by western blot analysis. Protein loading was determined by endogenous β-tubulin levels. (D) The relative intensity of LC3-II compared with β-tubulin levels was determined using ImageJ software. Mock + Rm showed statistically significant higher levels of relative LC3-II intensity than Mock + H20 or Mock + DMSO (*p < 0.01). These results show that Rm increased autophagic signaling in HL-1 cells. Also, CVB3 infection alone increased autophagic signaling in HL-1 cells (**p < 0.001). (E) Viral titers increased in RM-treated HL-1 cells as compared with DMSO treatment alone, although the increase was not statistically significant. ANOVA with Newman-Keuls post-hoc analysis was utilized to determine statistical significance.
None
Figure 4. No change in the level of LC3 puncta formation in undifferentiated NPSCs following CVB3 infection. Undifferentiated NPSCs were transduced with Adeno-GFP-LC3, infected with dsRed-CVB3, and observed by fluorescence microscopy at 63X at the indicated time points. (A) Viral titers were determined by plaque assay. Viral titers increased over time, but were not significantly different due to large variance, as determined by ANOVA with Newman-Keuls post-hoc analysis. (B) Quantification of autophagosomes was performed by counting 50–200 GFP-LC3 positive cells per well, with 3–5 wells per treatment, and values are represented as the mean +SEM. No difference in the level of autophagy between mock and infected undifferentiated NPSCs was observed for any of the time points analyzed, as determined by Student’s t-test. (C) Representative 63X fluorescent images are shown for each time point and treatment.
None
Figure 5. Undifferentiated NPSCs exhibited a higher basal level of autophagic signaling, as compared with HL-1 cells. (A) HL-1 cells and undifferentiated NPSCs were infected with dsRed-CVB3 for 24 h, and protein extracts from lysed cells were analyzed for LC3-I and LC3-II levels by western blot analysis. Protein loading was determined by endogenous β-tubulin levels. (B) The relative intensity of LC3-II compared with β-tubulin levels was determined using Image J software. A statistically significant increase (*p < 0.05) in relative LC3-II intensity was observed between Infected and Mock HL-1 cells by ANOVA with Newman-Keuls post-hoc analysis. Also, a greater (although not statistically significant) level of relative LC3-II intensity was observed for Mock NPSCs and Infected NPSCs, as compared with Mock HL-1 cells. No statistical significant difference was observed between Infected HL-1 cells, Mock NPSCs and Infected NPSCs, thus indicating a higher basal level of autophagy in NPSCs regardless of viral infection. (C) No statistical difference was observed for viral titers between Infected HL-1 cells and Infected NPSCs by Student’s t-test (p = 0.0734).
None
Figure 6. Rapamycin induced autophagic signaling in undifferentiated NPSCs but did not alter CVB3 replication. (A) Undifferentiated NPSCs were treated with dimethyl sulfoxide (DMSO, vehicle control) or DMSO + rapamycin (Rm) for 24 h. Protein extracts from lysed cells were analyzed for LC3-II levels by western blot analysis. Protein loading was determined by endogenous β-tubulin levels. (B) The relative intensity of LC3-II compared with β-tubulin levels was determined using ImageJ software. Mock + Rm showed statistically significant higher levels of relative LC3-II intensity than Mock + H20 (***p < 0.001) or Mock + DMSO (**p < 0.001). These results show that Rm could further increase autophagic signaling in NPSCs. Also, CVB3 infection suppressed Rm-induced autophagic signaling in NPSCs (*p < 0.05). (C) No statistically significant difference (p = 0.2983) was found in viral titers between Infected + H2O, Infected + DMSO or Infected + Rm at 24 h PI. These results demonstrated that rapamycin-induced increases in autophagy within undifferentiated NPSCs failed to alter CVB3 replication levels. ANOVA with Newman-Keuls post-hoc analysis was utilized to determine statistical significance.
None
Figure 7. Decreased levels of LC3 puncta formation in differentiated NPSCs following CVB3 infection. NPSCs were differentiated for 5 d on gelatin/fibronectin coated chamber slides, transduced with Adeno-GFP-LC3, infected with dsRed-CVB3, and observed by fluorescence microscopy at 63X at the indicated time points. (A) Viral titers were determined by plaque assay. Viral titers in infected cells were significantly higher at 8 h and 24 h PI (*p < 0.05), as compared with 1 h PI. No viral titers were found in mock infected cells. (B) At 1 h, 8 h and 24 h PI, a significant decrease in GFP-LC3 autophagosome vacuoles were observed following infection, as compared with mock-infected cells (p = 0.008, p = 0.0154 and p = 0.0019, respectively). (C) Representative 63X images depicted for each time point and treatment showing decreased GFP-LC3 autophagosome vacuoles in differentiated NPSCs infected with dsRed-CVB3. Possible megaphagosomes are depicted (white arrows) in 72 h PI images. Quantification of cells with high levels of GFP-LC3 vacuoles (defined as greater than 30 punctate per cell) was performed by counting 200 transduced cells per well, with three wells per treatment (represented as the mean +SEM). ANOVA with Newman-Keuls post-hoc analysis was utilized to determine statistical significance for each experiment.
None
Figure 8. Differentiated NPSCs treated with both 3-MA and CCPA showed an increase in viral titers following CVB3 infection. (A) The level of autophagy in differentiated NPSCs decreased (*p < 0.01) in the presence of 3-MA (inhibitor of autophagy), as compared with mock or CCPA treatment (inducer of autophagy). (B) No change in the level of autophagy (left y-axis) was observed in infected differentiated NPSCs following 3-MA or CCPA treatment. Mock-treated differentiated NPSCs were significantly different (*p < 0.05) than all other treatments. Viral titers (right y-axis) were significantly different (**p < 0.01) between 3-MA + Infected vs. Infected alone and CCPA + Infected and a highly significantly different (***p < 0.001) between Infected and CCPA + Infected, despite the similar level of autophagy in all of these treatments. (C) No bias in the level of autophagy was observed in the three downstream cell lineages of differentiated NPSCs following CVB3 infection. All three cell lineages showed a trend toward a reduction in the level of autophagy following infection, as compared with mock-infected. However, only GFAP+ cells were significantly different (*p < 0.05) in the level of autophagy following infection, as compared with mock-infected. Mock-infected OLIG2+ cells showed a significantly lower (*p < 0.05) level of autophagy, as compared with mock-infected GFAP+ cells. (D) Representative images of transduced cells (green) expressing each CNS lineage marker (blue). Quantification of cells with high levels of GFP-LC3 autophagosome vacuoles was performed by counting 200 transduced cells per well, with three wells per treatment (represented as the mean +SEM). ANOVA with Newman-Keuls post-hoc analysis was utilized to determine statistical significance.
None
Figure 9. The addition of fibroblast growth factor decreased autophagic signaling in differentiated NPSCs without affecting CVB3 replication. NPSCS were differentiated for 5 d on gelatin/fibronectin coated chamber slides and transduced [for (B and C) only] with Adeno-GFP-LC3. Differentiated NPSCs were infected with dsRed-CVB3 and/or treated with fibroblast growth factor (FGF). (A) Protein extracts from lysed cells were analyzed after 24 h for LC3-II levels by western blot analysis. (B) Representative 63X fluorescent images are depicted for each treatment. (C) Cells were fixed after 8 h and observed by fluorescence microscopy at 63X. Quantification of autophagosomes was performed by counting 200 transduced cells per well, with three wells per treatment, and represented as the mean +SEM. Mock treatment was statistically higher than all other treatments (*p < 0.01). No statistical difference was observed between any other treatments. (D) The relative intensity of LC3-II compared with β-tubulin levels was determined from (A) using ImageJ software. A statistically significant decrease in the relative intensity of LC3-II was observed between Mock and Mock + FGF (*p < 0.01), or Mock and Infected + FGF (**p < 0.05), indicating that FGF significantly decreased the level of autophagy in differentiated NPSCs. Also, the relative intensity of LC3-II was lower in Infected, as compared with Mock, although this difference was not statistically significant. ANOVA with Newman-Keuls post-hoc analysis was utilized to determine statistical significance for each experiment. (E) No difference (p = 0.6047) in viral titers was observed between Infected and Infected + FGF, as determined by Student’s t-test. These results indicate that altering autophagy levels in differentiated NPSCs did not affect CVB3 replication.
None
Figure 10. Bcl-2 levels remain unchanged in HL-1 cells, undifferentiated NPSCs and differentiated NPSCs following CVB3 infection. (A) HL-1 cells, (B) undifferentiated NPSCs and (C) differentiated (Diff) NPSCs were infected with dsRed-CVB3 for 24 h. Protein extracts from lysed cells were utilized for BCL2 western blot analysis. Protein loading levels were determined by endogenous β-tubulin levels. The quantification of BCL2 signal was performed using ImageJ software and normalized to β-tubulin levels for each cell type analyzed. No statistical difference in the level of BCL2 was observed following infection of HL-1 cells (p = 0.9648), NPSCs (p = 0.3877) or Diff NPSCs (p = 0.1138), as compared with mock-infected cells by Student’s t-test.

Similar articles

Cited by

References

    1. Gustafsson AB, Gottlieb RA. Recycle or die: the role of autophagy in cardioprotection. J Mol Cell Cardiol. 2008;44:654–61. doi: 10.1016/j.yjmcc.2008.01.010. - DOI - PMC - PubMed
    1. Klionsky DJ, Abeliovich H, Agostinis P, Agrawal DK, Aliev G, Askew DS, et al. Guidelines for the use and interpretation of assays for monitoring autophagy in higher eukaryotes. Autophagy. 2008;4:151–75. - PMC - PubMed
    1. Kudchodkar SB, Levine B. Viruses and autophagy. Rev Med Virol. 2009;19:359–78. doi: 10.1002/rmv.630. - DOI - PMC - PubMed
    1. Levine B, Mizushima N, Virgin HW. Autophagy in immunity and inflammation. Nature. 2011;469:323–35. doi: 10.1038/nature09782. - DOI - PMC - PubMed
    1. Deretic V. Multiple regulatory and effector roles of autophagy in immunity. Curr Opin Immunol. 2009;21:53–62. doi: 10.1016/j.coi.2009.02.002. - DOI - PMC - PubMed

Publication types

MeSH terms