. 2012 Jul 1;26(13):1486-97.
doi: 10.1101/gad.189035.112.

Synthetic memory circuits for tracking human cell fate

Affiliations

Synthetic memory circuits for tracking human cell fate

Devin R Burrill et al. Genes Dev. .

Abstract

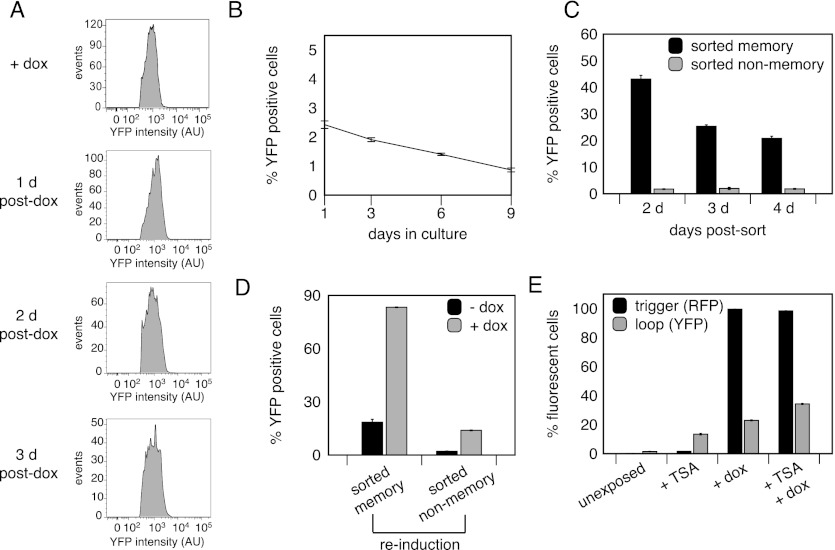
A variety of biological phenomena, from disease progression to stem cell differentiation, are typified by a prolonged cellular response to a transient environmental cue. While biologically relevant, heterogeneity in these long-term responses is difficult to assess at the population level, necessitating the development of biological tools to track cell fate within subpopulations. Here we present a novel synthetic biology approach for identifying and tracking mammalian cell subpopulations. We constructed three genomically integrated circuits that use bistable autoregulatory transcriptional feedback to retain memory of exposure to brief stimuli. These "memory devices" are used to isolate and track the progeny of cells that responded differentially to doxycycline, hypoxia, or DNA-damaging agents. Following hypoxic or ultraviolet radiation exposure, strongly responding cells activate the memory device and exhibit changes in gene expression, growth rates, and viability for multiple generations after the initial stimulus. Taken together, these results indicate that a heritable memory of hypoxia and DNA damage exists in subpopulations that differ in long-term cell behavior.


Figures

Figure 1.
Figure 1.
Design and testing of trigger and loop genes. (A) Schematic of dox trigger, reporter, and loop genes. (B) Synthetic ZFs (BCR-ABL #1 and 2, HIV #1 and 2, and erbB2 #1) were tested as transactivators via cotransfection with corresponding reporters. BCR-ABL #1 was also tested on a single plasmid with its corresponding reporter gene. (C) The BCR-ABL #1 trigger and loop were tested via cotransfection on separate plasmids. (D) The BCR-ABL #1 trigger was adapted to be sensitive to hypoxia or DNA damage. (E) The HRE and p53R2-RE triggers were tested on a single plasmid with their corresponding loop genes. (B,C,E) FACS determined the percent of cells positive for trigger RFP and reporter or loop YFP. Values represent mean ± SE; n = 3.
Figure 2.
Figure 2.
MD10/TetOx2 transmits memory of dox exposure. Memory behavior was analyzed by FACS (A) and fluorescence microscopy (B). FACS determined the percent of cells positive for trigger RFP and loop YFP. Values represent mean ± SE; n = 3. (C) Fluorescence microscopy montage of MD10/TetOx2, 24–28 h post-dox exposure. Phase, RFP, and YFP channels were overlaid. (Arrows) Dividing memory cells; (*) cells in which the circuit does not remain active after division.
Figure 3.
Figure 3.
Further characterization of MD10/TetOx2. (A) FACS plots of the YFP intensity of the memory cell subpopulation versus the event rate at several time points post-dox exposure. (B) Unexposed cells were tracked via FACS to determine the rate of spontaneous loop activation. (C) Memory and non-memory cells were sorted 2 d post-dox exposure and tracked by FACS to determine the percent of cells positive for loop YFP. (D) Sorted memory and non-memory cells were reinduced 3 d post-sort with dox, and FACS determined the percent of cells positive for loop YFP. (E) Cells were exposed to TSA, dox, or TSA + dox to identify epigenetic silencing of the device. FACS determined the percent of cells positive for trigger RFP and loop YFP. (A–E) Values represent mean ± SE; n = 3.
Figure 4.
Figure 4.
MD15/HRE device identifies a subpopulation with a unique memory of low O2 exposure. (A) Cells were exposed to anoxia and tracked by FACS for 2 d. (B) Cells were exposed to anoxia and recovered for 1 d. Memory cells (YFP+) were sorted and followed by microscopy for 6 d. (C) Cells were exposed to anoxia and recovered for 1 d. Non-memory cells were sorted and re-exposed to anoxia 6 d post-sort. (D) Cells were exposed to TSA, anoxia, or TSA + anoxia to identify epigenetic silencing of the device. (E) Cells were exposed to hypoxia and tracked by FACS for 2 d. (A,C,D,E) FACS determined the percent of cells positive for trigger RFP and loop YFP. Values represent mean ± SE; n = 3. (F) Cells were exposed to hypoxia and recovered for 1 d. MD10/TetOx2 was exposed to dox and recovered for 1 d. Cell death was measured in memory versus non-memory cells by FACS. Values represent mean ± SE; n = 3. (G) MD15/HRE and U2OS cells were exposed to hypoxia, and HIF target gene expression was measured. Values represent mean fold expression change over unexposed cells ± SE; n = 3. (H) Cells were exposed to hypoxia and recovered for 1 d. Memory and non-memory cells were sorted, and HIF target gene expression was measured in each subpopulation. Values represent mean fold expression change in memory versus non-memory cells ± SE; n = 2.
Figure 5.
Figure 5.
MD12/p53R2-RE device identifies a subpopulation with unique memory of DNA damage. (A) Cells were exposed to UV and tracked by FACS for 2 d. (B) Cells were exposed to UV and recovered for 1 d. Memory cells (YFP+) were sorted and followed by microscopy for 10 d. (C) Cells were exposed to UV and recovered for 1 d. Non-memory cells were sorted and re-exposed to UV 5 d post-sort. (D) Cells were exposed to TSA, UV, or TSA + UV to identify epigenetic silencing of the device. (A,C,D) FACS determined the percent of cells positive for trigger RFP and loop YFP. Values represent mean ± SE; n = 3. (E) Cells were exposed to UV and recovered for 2 d. Cell death was measured in memory versus non-memory cells by FACS. Values represent mean ± SE; n = 3. (F) MD12/p53R2-RE and U2OS cells were exposed to UV, and p53 target gene expression was measured. Values represent mean fold expression change over unexposed cells ± SE; n = 3. (G) Cells were exposed to UV and recovered for 1 d. Memory and non-memory cells were sorted, and p53 target gene expression was measured in each subpopulation. Values represent mean fold expression change in memory versus non-memory cells ± SE; n = 2.
Figure 6.
Figure 6.
MD12/p53R2-RE device identifies a subpopulation with a unique transcriptional profile. (A) Gene ontology enrichment of genes up-regulated in memory cells 3 d post-UV exposure. (B) Cells were exposed to UV and recovered for 1 d. Memory and non-memory cells were sorted, and gene expression was measured in each subpopulation. Values represent mean fold expression change in memory versus non-memory cells ± SE; n = 2.

References

    1. Acar M, Mettetal JT, van Oudenaarden A 2008. Stochastic switching as a survival strategy in fluctuating environments. Nat Genet 40: 471–475 - PubMed
    1. Ajo-Franklin CM, Drubin DA, Eskin JA, Gee EPS, Landgraf D, Phillips I, Silver PA 2007. Rational design of memory in eukaryotic cells. Genes Dev 21: 2271–2276 - PMC - PubMed
    1. Avery SV 2006. Microbial cell individuality and the underlying sources of heterogeneity. Nat Rev Microbiol 4: 577–587 - PubMed
    1. Becskei A, Séraphin B, Serrano L 2001. Positive feedback in eukaryotic gene networks: Cell differentiation by graded to binary response conversion. EMBO J 20: 2528–2535 - PMC - PubMed
    1. Beerli RR, Segal DJ, Dreier B, Barbas CF 1998. Toward controlling gene expression at will: Specific regulation of the erbB-2/HER-2 promoter by using polydactyl zinc finger proteins constructed from modular building blocks. Proc Natl Acad Sci 95: 14628–14633 - PMC - PubMed

Publication types