

Correlation between triazole treatment history and susceptibility in clinically isolated Aspergillus fumigatus
- PMID: 22751542
- PMCID: PMC3421857
- DOI: 10.1128/AAC.00514-12
Correlation between triazole treatment history and susceptibility in clinically isolated Aspergillus fumigatus
Abstract
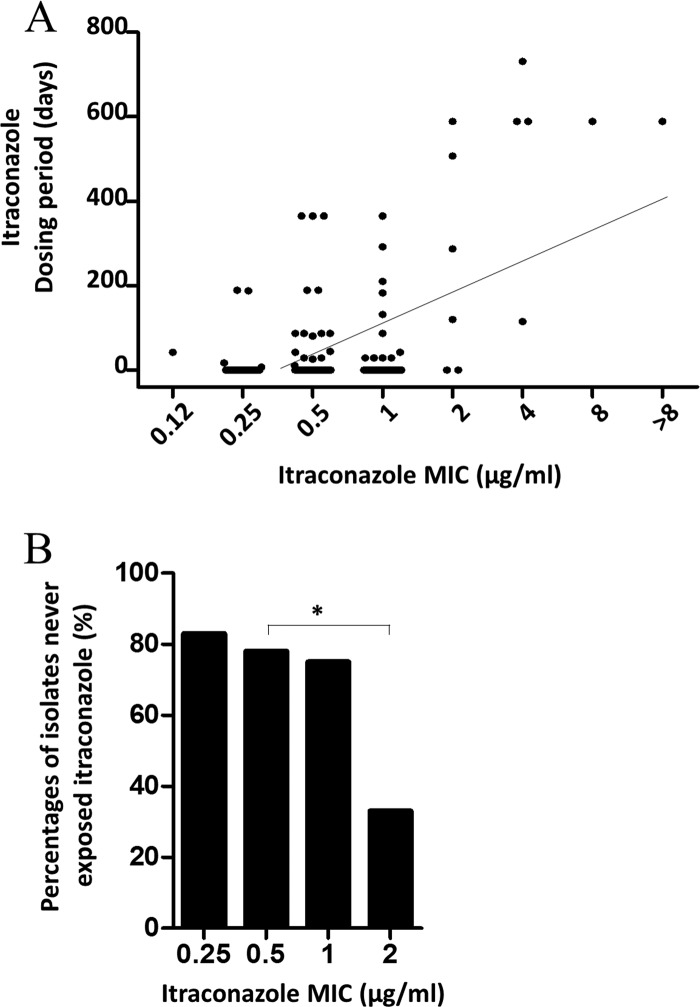
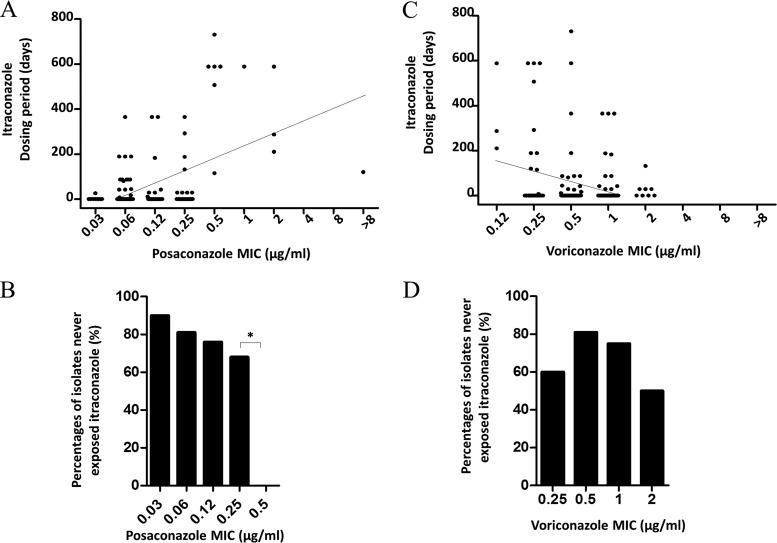
This is the first report of a detailed relationship between triazole treatment history and triazole MICs for 154 Aspergillus fumigatus clinical isolates. The duration of itraconazole dosage increased as the itraconazole MIC increased, and a positive correlation was observed (r = 0.5700, P < 0.0001). The number of itraconazole-naïve isolates dramatically decreased as the itraconazole MIC increased, particularly for MICs exceeding 2 μg/ml (0.5 μg/ml versus 2 μg/ml, P = 0.03). We also examined the relationship between cumulative itraconazole usage and the MICs of other azoles. A positive correlation existed between itraconazole dosage period and posaconazole MIC (r = 0.5237, P < 0.0001). The number of itraconazole-naïve isolates also decreased as the posaconazole MIC increased, particularly for MICs exceeding 0.5 μg/ml (0.25 μg/ml versus 0.5 μg/ml, P = 0.004). Conversely, the correlation coefficient obtained from the scattergram of itraconazole usage and voriconazole MICs was small (r = -0.2627, P = 0.001). Susceptibility to three triazole agents did not change as the duration of voriconazole exposure changed. In addition, we carried out detailed analysis, including microsatellite genotyping, for isolates obtained from patients infected with azole-resistant A. fumigatus. We confirmed the presence of acquired resistance to itraconazole and posaconazole due to a G54 substitution in the cyp51A gene for a patient with chronic pulmonary aspergillosis after oral itraconazole therapy. We should consider the possible appearance of azole-resistant A. fumigatus if itraconazole is used for extended periods.
Figures
Similar articles
-
In vitro acquisition of secondary azole resistance in Aspergillus fumigatus isolates after prolonged exposure to itraconazole: presence of heteroresistant populations.Antimicrob Agents Chemother. 2012 Jan;56(1):174-8. doi: 10.1128/AAC.00301-11. Epub 2011 Oct 17. Antimicrob Agents Chemother. 2012. PMID: 22006000 Free PMC article.
-
In Vitro Activity of ASP2397 against Aspergillus Isolates with or without Acquired Azole Resistance Mechanisms.Antimicrob Agents Chemother. 2015 Nov 9;60(1):532-6. doi: 10.1128/AAC.02336-15. Print 2016 Jan. Antimicrob Agents Chemother. 2015. PMID: 26552973 Free PMC article.
-
Epidemiological cutoff values for azoles and Aspergillus fumigatus based on a novel mathematical approach incorporating cyp51A sequence analysis.Antimicrob Agents Chemother. 2012 May;56(5):2524-9. doi: 10.1128/AAC.05959-11. Epub 2012 Feb 13. Antimicrob Agents Chemother. 2012. PMID: 22330922 Free PMC article.
-
Rapid induction of multiple resistance mechanisms in Aspergillus fumigatus during azole therapy: a case study and review of the literature.Antimicrob Agents Chemother. 2012 Jan;56(1):10-6. doi: 10.1128/AAC.05088-11. Epub 2011 Oct 17. Antimicrob Agents Chemother. 2012. PMID: 22005994 Free PMC article. Review.
-
[The Current Status of Drug-resistant Aspergillus].Med Mycol J. 2016;57(3):J103-12. doi: 10.3314/mmj.16.001. Med Mycol J. 2016. PMID: 27581778 Review. Japanese.
Cited by
-
Chronic pulmonary aspergillosis: comprehensive insights into epidemiology, treatment, and unresolved challenges.Ther Adv Infect Dis. 2024 Jun 18;11:20499361241253751. doi: 10.1177/20499361241253751. eCollection 2024 Jan-Dec. Ther Adv Infect Dis. 2024. PMID: 38899061 Free PMC article. Review.
-
Triazole Resistance in Aspergillus spp.: A Worldwide Problem?J Fungi (Basel). 2016 Jul 4;2(3):21. doi: 10.3390/jof2030021. J Fungi (Basel). 2016. PMID: 29376938 Free PMC article. Review.
-
Aspergillus fumigatus and aspergillosis: From basics to clinics.Stud Mycol. 2021 May 10;100:100115. doi: 10.1016/j.simyco.2021.100115. eCollection 2021 Sep. Stud Mycol. 2021. PMID: 34035866 Free PMC article. Review.
-
Genetic and Phenotypic Characterization of in-Host Developed Azole-Resistant Aspergillus flavus Isolates.J Fungi (Basel). 2021 Feb 25;7(3):164. doi: 10.3390/jof7030164. J Fungi (Basel). 2021. PMID: 33668871 Free PMC article.
-
In vivo efficacy of pitavastatin combined with itraconazole against Aspergillus fumigatus in silkworm models.Microbiol Spectr. 2023 Sep 1;11(5):e0266623. doi: 10.1128/spectrum.02666-23. Online ahead of print. Microbiol Spectr. 2023. PMID: 37655910 Free PMC article.
References
-
- Alanio A, et al. 2011. Low prevalence of resistance to azoles in Aspergillus fumigatus in a French cohort of patients treated for haematological malignancies. J. Antimicrob. Chemother. 66:371–374 - PubMed
-
- Arabatzis M, et al. 2011. Polyphasic identification and susceptibility to seven antifungals of 102 Aspergillus isolates recovered from immunocompromised hosts in Greece. Antimicrob. Agents Chemother. 55:3025–3030 doi:10.1128/AAC.01491-10 - DOI - PMC - PubMed
-
- Arendrup MC, et al. 2010. Development of azole resistance in Aspergillus fumigatus during azole therapy associated with change in virulence. PLoS One 5:e10080 doi:10.1371/journal.pone.0010080 - DOI - PMC - PubMed
Publication types
MeSH terms
Substances
LinkOut - more resources
Full Text Sources
Molecular Biology Databases
