. 2012 Sep;32(17):3541-53.
doi: 10.1128/MCB.00437-12. Epub 2012 Jul 2.

Cell death and autophagy under oxidative stress: roles of poly(ADP-Ribose) polymerases and Ca(2+)

Affiliations

Cell death and autophagy under oxidative stress: roles of poly(ADP-Ribose) polymerases and Ca(2+)

Philippe Wyrsch et al. Mol Cell Biol. 2012 Sep.

Abstract

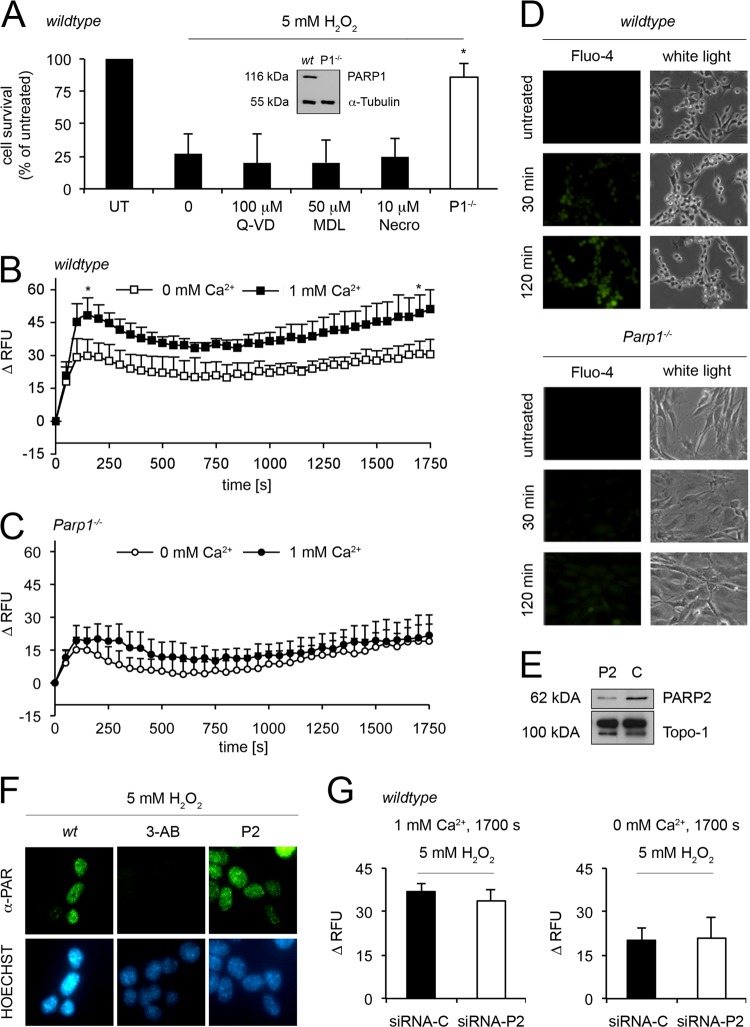
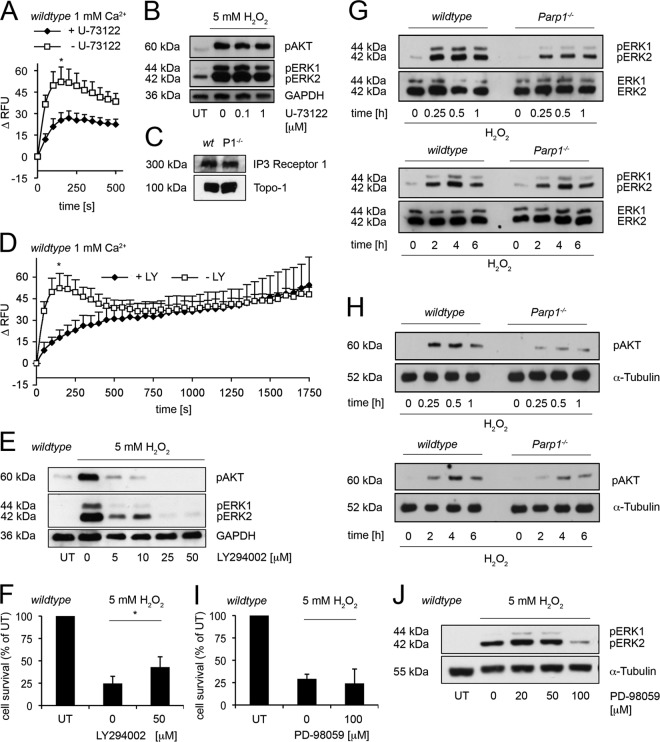
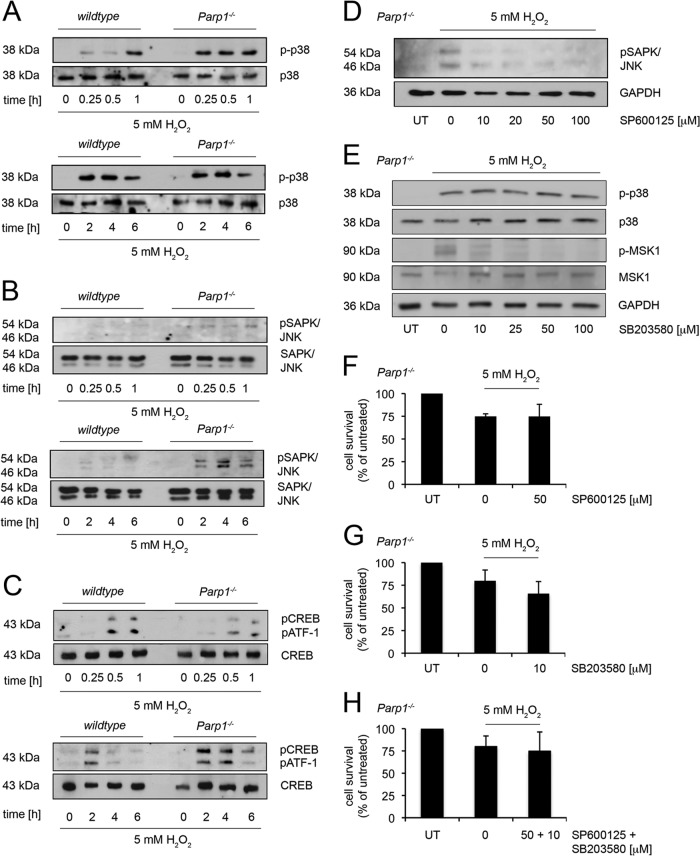
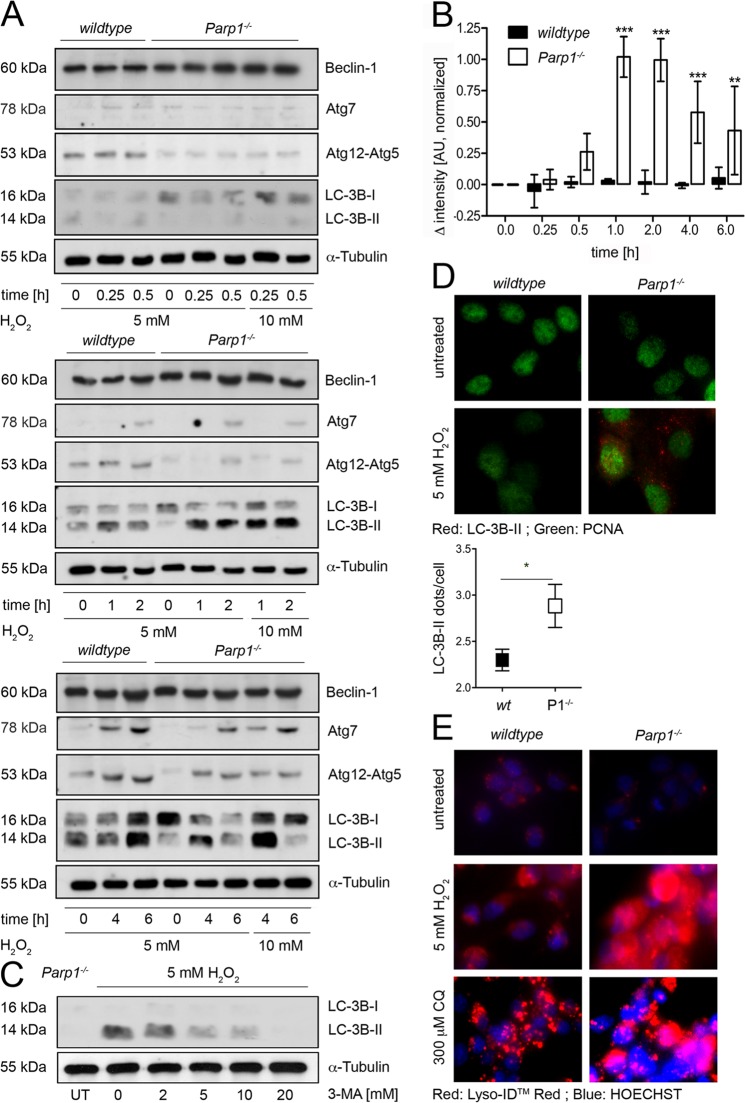
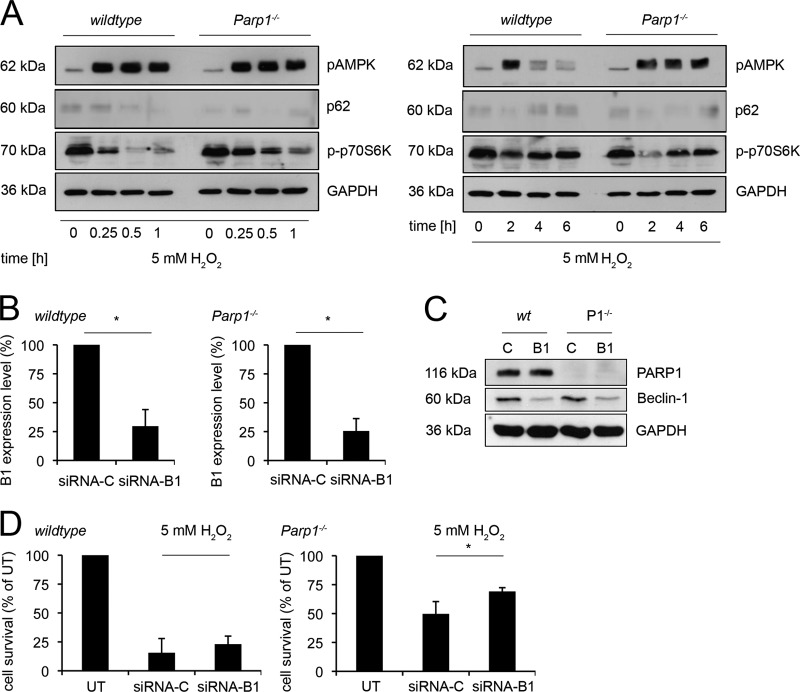
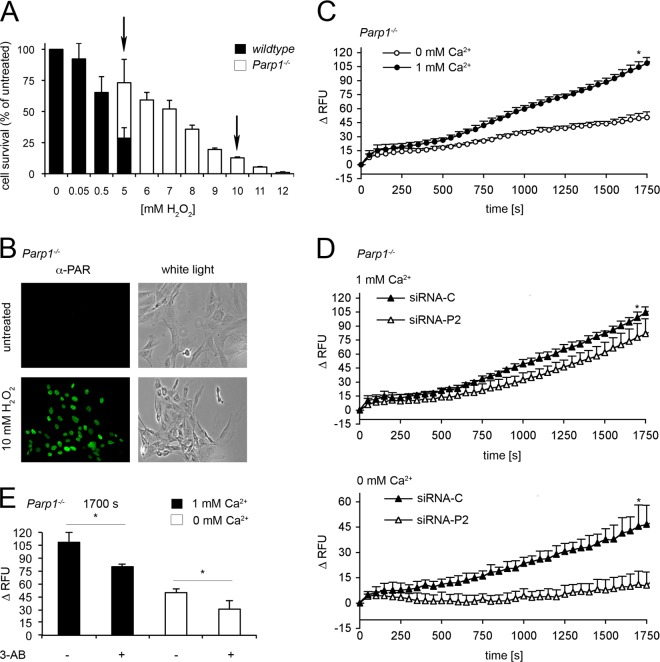
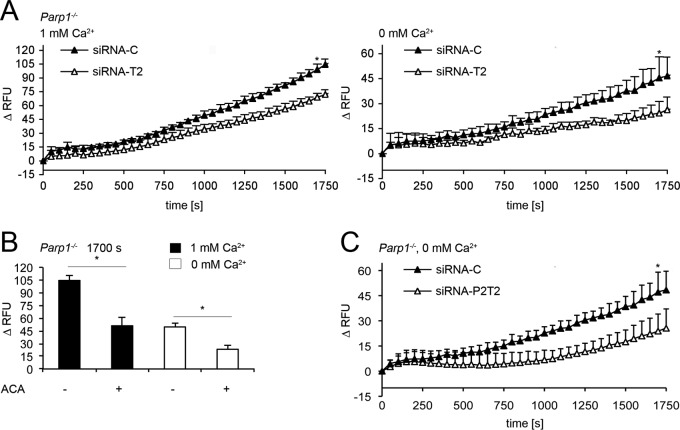
On the cellular level, oxidative stress may cause various responses, including autophagy and cell death. All of these outcomes involve disturbed Ca(2+) signaling. Here we show that the nuclear enzymes poly(ADP-ribose) polymerase 1 (PARP1) and PARP2 control cytosolic Ca(2+) shifts from extracellular and intracellular sources associated with autophagy or cell death. The different Ca(2+) signals arise from the transient receptor potential melastatin 2 (TRPM2) channels located in the cellular and lysosomal membranes. They induce specific stress kinase responses of canonical autophagy and cell death pathways. Autophagy is under the control of PARP1, which operates as an autophagy suppressor after oxidative stress. Cell death is activated downstream of extracellular signal-regulated kinase 1/2 (ERK1/2) and AKT, whereas cell survival correlates with the phosphorylation of p38, stress-activated protein kinase/Jun amino-terminal kinase (SAPK/JNK), and cyclic AMP response element-binding protein (CREB) with its activating transcription factor (ATF-1). Our results highlight an important role for PARP1 and PARP2 in the epigenetic control of cell death and autophagy pathways.


Figures

Fig 1
Fig 1
Impact of H2O2 on cell survival, Ca2+ levels in WT and Parp1−/− cells, and the role of PARP2 in WT cells. (A) WT cells were treated (additional 1 h pretreatment) with Q-VD-OPh (100 μM; n = 4), MDL 28170 (50 μM; n = 3) or necrostatin 1 (no pretreatment; 10 μM; n = 7) and 5 mM H2O2 (mean ± SD; not significant; t test). Parp1−/− (P1−/−) cells were also treated with 5 mM H2O2 (mean ± SD; *, P < 0.0001; n = 7; t test). Cell survival was monitored by AlamarBlue. Western blot analysis of PARP1 in untreated (UT) WT and Parp1−/− cells. α-Tubulin was used as the control. (B) Fluo-4 assay of WT cells treated with 5 mM H2O2. Ca2+ determinations with and without extracellular Ca2+ ions were made directly after treatment with H2O2 for 30 min and were expressed as ΔRFU compared to the basal levels (mean ± SD; *, P < 0.005; n = 4; t test). (C) Ca2+ shifts after the treatment of Parp1−/− cells with 5 mM H2O2 with and without extracellular Ca2+ ions (mean ± SD; not significant; n ≥ 5; t test). (D) Microscopic visualization of intracellular Ca2+ shifts after a challenge of WT and Parp1−/− cells with 5 mM H2O2 (for 30 or 120 min) using the Ca2+ indicator Fluo-4. White light was used as the control. (E) Western blot analysis of WT cells with Parp2 (P2) or a control (C) silenced. Topo-1 was the loading control. (F) PAR detection and Hoechst staining by immunofluorescence after treatment with 5 mM H2O2 (30 min) in control MEFs (WT) and cells treated overnight with 3 mM 3-AB or with Parp2 silenced (P2). (G, left side) Comparison of Ca2+ levels at 1,700 s in WT cells with Parp2 (siRNA-P2) or a control (siRNA-C) silenced after treatment with 5 mM H2O2 (mean ± SD; not significant; n = 4; t test) with extracellular Ca2+. (G, right side) Comparison of Ca2+ levels at 1,700 s in WT cells with Parp2 (siRNA-P2) or a control (siRNA-C) silenced after treatment with 5 mM H2O2 (mean ± SD; not significant; n ≥ 4; t test) without extracellular Ca2+.
Fig 2
Fig 2
PI3K acts upstream in oxidant-induced cell death. (A) Cytosolic Ca2+ shifts after treatment with 5 mM H2O2 in control (− U-73122) WT cells and those treated with 1 μM U-73122 (+ U-73122). Results represent the mean ± SD (*, P < 0.0005; n ≥ 3; t test). (B) Western blot analysis of pAKT and pERK1/2 in WT cells treated with different doses of U-73122 as indicated (pretreatment for 5 min) and 5 mM H2O2 for 30 min. GAPDH was used as the control. (C) Western blot analysis of IP3 receptor 1 in WT and Parp1−/− (P1−/−) cells shown. Topo-1 was the loading control. (D) Cytosolic Ca2+ shifts after treatment with 5 mM H2O2 in control (− LY) WT cells and those treated with 50 μM LY294002 (+ LY) (pretreatment for 30 min). Results represent the mean ± SD (*, P < 0.0001; n ≥ 3; t test). (E) Western blot analysis of pAKT and pERK1/2 in WT cells treated with different doses of LY294002 as indicated (pretreatment for 30 min) and 5 mM H2O2 for 30 min. GAPDH was used as the control. (F) Cytotoxicity assay of WT cells treated or not treated with LY294002 (1 h pretreatment, 50 μM) and 5 mM H2O2 (mean ± SD; *, P < 0.05; n = 4; t test). (G) Western blot analysis of phosphorylated ERK1/2 (pERK1/2). ERK1/2 was used as the control for WT and Parp1−/− cells treated with 5 mM H2O2 for the times indicated. (H) Western blot analysis of phosphorylated AKT (pAKT) in 5 mM H2O2-treated WT and Parp1−/− MEFs at the indicated time points. α-Tubulin was the loading control. (I) Cytotoxicity assay of WT cells treated or not treated with PD-98059 (pretreatment overnight) and 5 mM H2O2 (mean ± SD; not significant; n = 3; t test). (J) Western blot analysis of pERK1/2 in WT cells treated with PD-98059 as indicated (pretreatment overnight) and 5 mM H2O2 for 1 h. α-Tubulin was the loading control. UT, untreated.
Fig 3
Fig 3
The role of PARP1 in Ca2+-independent stress signaling. (A) Western blot analysis of p-p38 in WT and Parp1−/− cells treated with 5 mM H2O2 for the times indicated. Unphosphorylated p38 was the loading control. (B) Western blot analysis of pSAPK/JNK in WT and Parp1−/− cells treated with 5 mM H2O2 for the times indicated. Unphosphorylated SAPK/JNK was the loading control. (C) Western blot analysis of pCREB and pATF-1 in WT and Parp1−/− cells treated with 5 mM H2O2 for the times indicated. Unphosphorylated CREB was the loading control. (D) Western blot analysis of pSAPK/JNK in Parp1−/− cells treated with increasing doses of SP600125 (1 h pretreatment) as indicated and 5 mM H2O2 for 4 h. GAPDH was the loading control. (E) Western blot analysis of p-p38, p-38, p-MSK1, and MSK1 in Parp1−/− cells treated with 5 mM H2O2 and increasing doses of SB203580 as indicated for 2 h. GAPDH was the loading control. (F) Survival was monitored in Parp1−/− cells treated with 50 μM SP600125 (1 h pretreatment) and 5 mM H2O2 (mean ± SD; not significant; n = 3; t test). (G) Survival was monitored in Parp1−/− cells treated with 10 μM SB203580 (1 h pretreatment) and 5 mM H2O2 (mean ± SD; not significant; n = 4; t test). (H) Survival was monitored in Parp1−/− cells treated with 50 μM SP600125 together with 10 μM SB203580 (1 h pretreatment) and 5 mM H2O2 (mean ± SD; not significant; n = 4; t test). UT, untreated.
Fig 4
Fig 4
PARP1 is involved in autophagy signaling after H2O2 treatment. (A) Western blot analysis of beclin-1, Atg7, Atg12-Atg5, and LC-3B-II in WT or Parp1−/− cells after H2O2 treatment as indicated. α-Tubulin was the loading control. (B) Statistical analysis of LC-3B-II Western blot signals of 5 mM H2O2-treated WT or Parp1−/− cells at the indicated time points. Results are shown as arbitrary units (AU) normalized to GAPDH or α-tubulin (mean ± SD; **, P < 0.01; ***, P < 0.001; n ≥ 4; two-way ANOVA with Bonferroni multiple-comparison posttest). (C) Western blot analysis of LC-3B-II in Parp1−/− cells pretreated for 1 h with increasing doses of 3-MA before a challenge with 5 mM H2O2 for 2 h. (D, top) LC-3B-II and PCNA staining by immunofluorescence in WT and Parp1−/− cells treated with 5 mM H2O2 after 2 h. (D, bottom) Quantification of LC-3B-II dots in WT (n = 142) and Parp1−/− cells (P1−/−; n = 94) after 2 h of H2O2 treatment (mean ± standard error of the mean; *, P < 0.025; t test). Only LC-3B-II-positive cells were considered. (E) Visualization of acidic organelles with Lyso-ID Red dye in WT and Parp1−/− cells after 2 h of 5 mM H2O2 treatment or after 2 h of 300 μM CQ treatment with Hoechst staining as the control. UT, untreated.
Fig 5
Fig 5
H2O2 induction of mTOR-mediated autophagy and role of beclin-1 in H2O2-induced PARP1-dependent cell death. (A) Western blot analysis of phosphorylated AMPK (pAMPK) in WT and Parp1−/− cells at the indicated time points after treatment with 5 mM H2O2. The levels of phosphorylated p70S6K (p-p70S6K) are also shown, as well as p62. α-Tubulin was the loading control. (B) Becn1 mRNA levels of WT and Parp1−/− cells with the Becn1 gene silenced (siRNA-B1) or not silenced (siRNA-C) as determined by RT-PCR normalized to GAPDH (mean ± SD; *, P < 0.0001; n = 3; t test). (C) Western blot analysis of WT and Parp1−/− (P1−/−) cells with Becn1 (B1) or a control (C) silenced. PARP1 and GAPDH were controls. (D) Assay of cytotoxicity of treatment with 5 mM H2O2 of WT (n = 4) and Parp1−/− cells (n = 4) with Becn1 (siRNA-B1) or a control (siRNA-C) silenced (mean ± SD; not significant in WT; *, P < 0.025 in Parp1/ cells; t test). UT, untreated.
Fig 6
Fig 6
Treatment with 10 mM H2O2 induces PAR formation and cytosolic Ca2+ shifts in Parp1−/− cells. (A) WT and Parp1−/− cells were treated with increasing concentrations of H2O2 as indicated. Cell survival was determined (n ≥ 4). (B) PAR detection in Parp1−/− cells by immunofluorescence after 30 min of treatment with 10 mM H2O2. White light was used as the control. (C) Fluo-4 assay of Parp1−/− cells treated with 10 mM H2O2 with and without extracellular Ca2+. Results represent the mean ± SD (*, P < 0.0001; n = 4; t test). (D, top) Cytosolic Ca2+ shifts of Parp1−/− cells with Parp2 (siRNA-P2) or a control (siRNA-C) silenced after treatment with 10 mM H2O2 in Ca2+-containing buffer (mean ± SD; *, P < 0.05; n = 4; t test). (D, bottom) Same as before but in the absence of extracellular Ca2+ (mean ± SD; *, P < 0.005; n = 4; t test). (E) Comparison of cytosolic Ca2+ levels at 1,700 s after treatment with 10 mM H2O2 in Parp1−/− control and 3-AB treated cells (3 mM 3-AB overnight) in the presence (mean ± SD; *, P < 0.005; n ≥ 3; t test) or absence of extracellular Ca2+ (mean ± SD; *, P = 0.0005; n = 5; t test).
Fig 7
Fig 7
Intracellular TRPM2 channels release Ca2+ in Parp-1−/− cells after H2O2 treatment. (A, left side) Fluo-4 assays with extracellular Ca2+ in Parp1−/− cells with Trpm2 (siRNA-T2) or a control (siRNA-C) silenced after treatment with 10 mM H2O2 (mean ± SD; *, P < 0.00025; n = 4; t test). (A, right side) Fluo-4 assays done as before but without extracellular Ca2+ (mean ± SD; *, P < 0.05; n ≥ 3; t test). (B) Comparison of cytosolic Ca2+ levels at 1,700 s after treatment with 10 mM H2O2 in Parp1−/− control and ACA-treated cells (pretreatment for 5 min; 5 μM) with extracellular Ca2+ (mean ± SD; *, P < 0.0001; n ≥ 3; t test) and without Ca2+ (mean ± SD; *, P = 0.0001; n = 3; t test). (C) Cytosolic Ca2+ shifts in Parp1−/− cells with both Parp2 and Trpm2 (siRNA-P2T2) or a control (siRNA-C) silenced after treatment with 10 mM H2O2 in the absence of extracellular Ca2+ (mean ± SD; *, P < 0.0025; n ≥ 3; t test).
Fig 8
Fig 8
Roles of PARP1 and PARP2 in the oxidative stress response leading to cell death, autophagy, or cell survival. (A) Summary of PARP1- and PARP2-driven, TRPM2-mediated cytosolic Ca2+ responses after H2O2-induced DNA damage. (B) A moderate stress level (5 mM H2O2) mobilizes Ca2+ via activation of PARP1. PARP1 produces the activating signal (ADPR) for the plasma membrane TRPM2 channel in conjunction with PARG (14). This, in combination with the phosphorylation of ERK1/2 and AKT, causes cell death in WT MEFs. A moderate stress level (5 mM H2O2) in a Parp1−/− background involves the phosphorylation of p38, SAPK/JNK, and CREB/ATF-1 and activates autophagy markers, leading to cell survival. PARP1 operates as a checkpoint between cell survival and death or autophagy. A high level of oxidative stress (10 mM H2O2) triggers late autophagy steps and leads to the activation of PARP2 activity in a Parp1−/− background. This ends in Ca2+ mobilization from lysosomes, the only other known localization of TRPM2, leading to cell death.

Similar articles

Cited by

References

    1. Bari MR, et al. 2009. H2O2-induced Ca2+ influx and its inhibition by N-(p-amylcinnamoyl) anthranilic acid in the beta-cells: involvement of TRPM2 channels. J. Cell Mol. Med. 13: 3260–3267 - PMC - PubMed
    1. Blanc A, Pandey NR, Srivastava AK. 2003. Synchronous activation of ERK 1/2, p38mapk and PKB/Akt signaling by H2O2 in vascular smooth muscle cells: potential involvement in vascular disease (review). Int. J. Mol. Med. 11: 229–234 - PubMed
    1. Blenn C, Wyrsch P, Bader J, Bollhalder M, Althaus FR. 2011. Poly(ADP-ribose)glycohydrolase is an upstream regulator of Ca2+ fluxes in oxidative cell death. Cell. Mol. Life Sci. 68: 1455–1466 - PMC - PubMed
    1. Bowman EJ, Siebers A, Altendorf K. 1988. Bafilomycins: a class of inhibitors of membrane ATPases from microorganisms, animal cells, and plant cells. Proc. Natl. Acad. Sci. U. S. A. 85: 7972–7976 - PMC - PubMed
    1. Cheng WT, et al. 2009. Oxidative stress promotes autophagic cell death in human neuroblastoma cells with ectopic transfer of mitochondrial PPP2R2B (Bbeta2). BMC Cell Biol. 10: 91 doi:10.1186/1471-2121-10-91 - DOI - PMC - PubMed

Publication types

LinkOut - more resources