

Glucose response curve and type 2 diabetes risk in Latino adolescents
- PMID: 22751962
- PMCID: PMC3424993
- DOI: 10.2337/dc11-2476
Glucose response curve and type 2 diabetes risk in Latino adolescents
Abstract
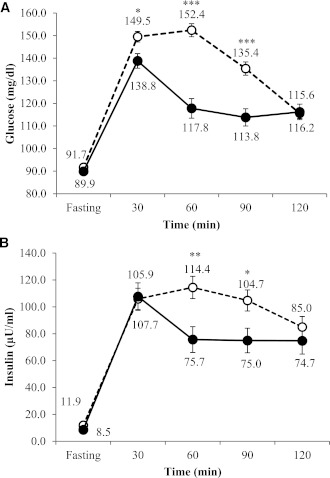
Objective: In adults, the shape of the glucose response during an oral glucose tolerance test (OGTT) prospectively and independently predicts type 2 diabetes. However, no reports have described the utility of this indicator in younger populations. The purpose of this study was to compare type 2 diabetes risk factors in Latino adolescents characterized by either a monophasic or biphasic glucose response during an OGTT.
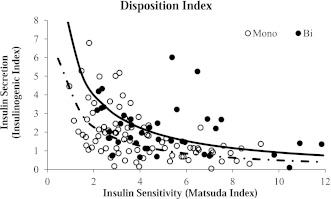
Research design and methods: A total of 156 nondiabetic Latino adolescents completed a 2-h OGTT. Monophasic and biphasic groups were compared for the following type 2 diabetes risk factors: fasting and 2-h glucose, HbA(1c), glucose area under the curve (AUC), insulin sensitivity (Matsuda index), insulin secretion (insulinogenic index), and β-cell function as measured by the disposition index (insulin sensitivity × insulin secretion).
Results: Of the participants, 107 youth were categorized as monophasic and 49 were biphasic. Compared with the monophasic group, participants with a biphasic response exhibited lower HbA(1c) (5.4 ± 0.3 vs. 5.6 ± 0.3%, P < 0.01) and lower glucose AUC (14,205 ± 2,382 vs. 16,230 ± 2,537 mg ⋅ dL(-1) ⋅ h(-1), P < 0.001) with higher insulin sensitivity (5.4 ± 3.2 vs. 4.6 ± 3.4, P ≤ 0.05), higher insulin secretion (2.1 ± 1.3 vs. 1.8 ± 1.3, P = 0.05), and better β-cell function (10.3 ± 7.8 vs. 6.0 ± 3.6, P < 0.001). Differences persisted after adjusting for age, sex, and BMI.
Conclusions: These data suggest that the glycemic response to an OGTT may differentiate risk for type 2 diabetes in youth. This response may be an early marker of type 2 diabetes risk among high-risk youth.
Figures
References
-
- Ogden CL, Flegal KM, Carroll MD, Johnson CL. Prevalence and trends in overweight among US children and adolescents, 1999-2000. JAMA 2002;288:1728–1732 - PubMed
-
- Fagot-Campagna A. Emergence of type 2 diabetes mellitus in children: epidemiological evidence. J Pediatr Endocrinol Metab 2000;13(Suppl. 6):1395–1402 - PubMed
-
- Dabelea D, Bell RA, D’Agostino RB, Jr, et al. Writing Group for the SEARCH for Diabetes in Youth Study Group Incidence of diabetes in youth in the United States. JAMA 2007;297:2716–2724 - PubMed
-
- Report of the Expert Committee on the Diagnosis and Classification of Diabetes Mellitus. Diabetes Care 1997;20:1183–1197 - PubMed
Publication types
MeSH terms
Substances
Grants and funding
LinkOut - more resources
Full Text Sources
Medical
Miscellaneous
