. 2012 Jul 17;109(29):11818-23.
doi: 10.1073/pnas.1205995109. Epub 2012 Jun 29.

Dysregulation of fatty acid synthesis and glycolysis in non-Hodgkin lymphoma

Affiliations

Dysregulation of fatty acid synthesis and glycolysis in non-Hodgkin lymphoma

Aadra P Bhatt et al. Proc Natl Acad Sci U S A. .

Abstract

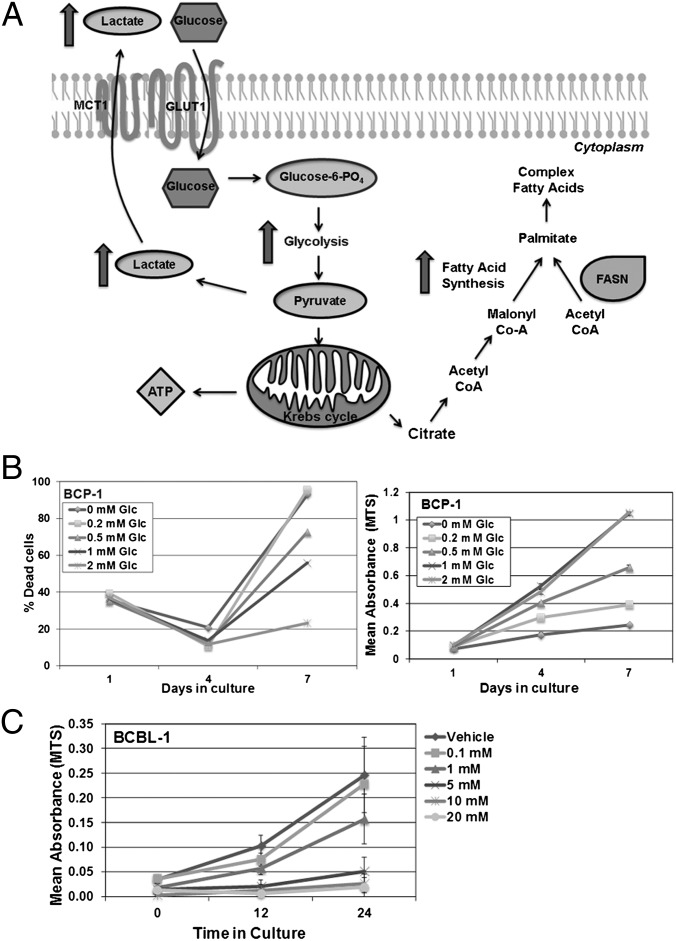
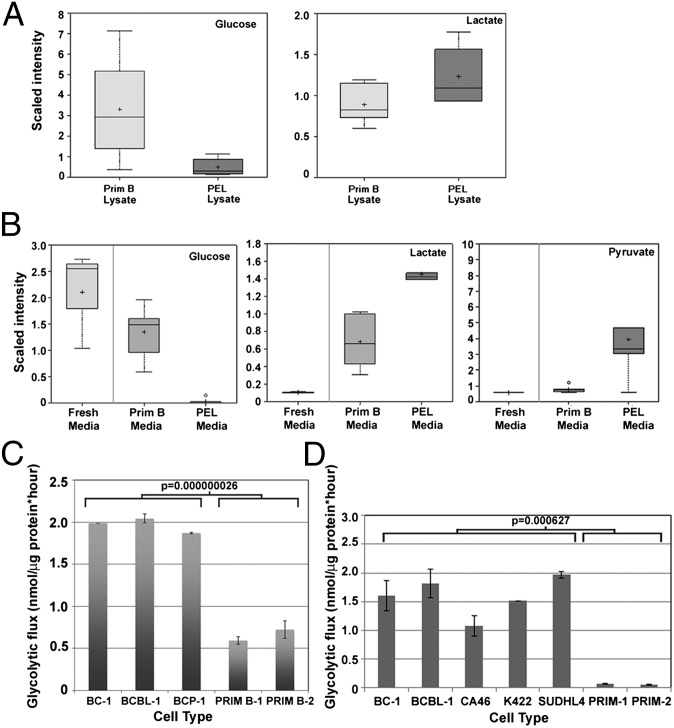
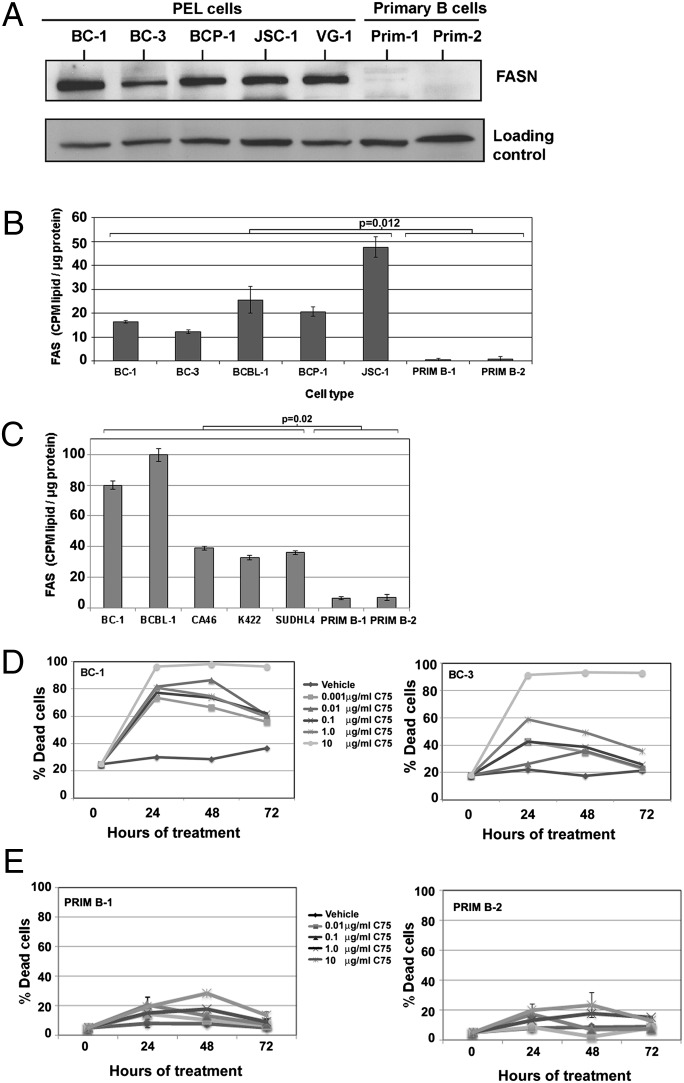
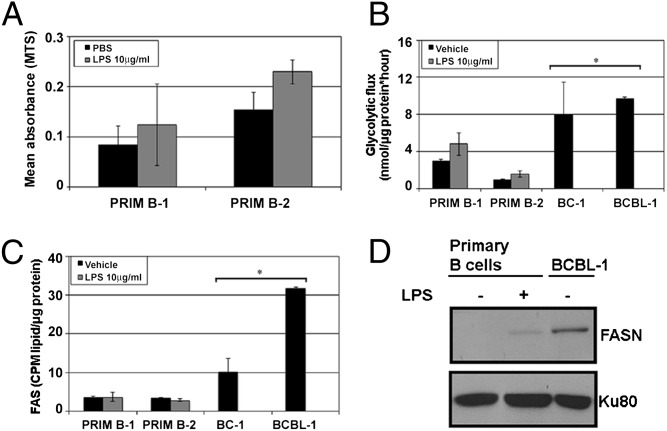
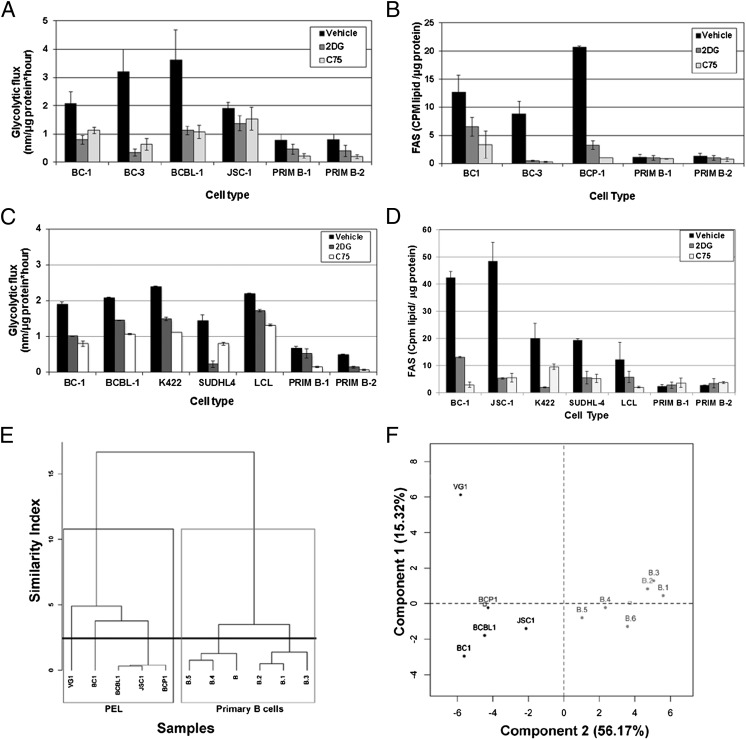
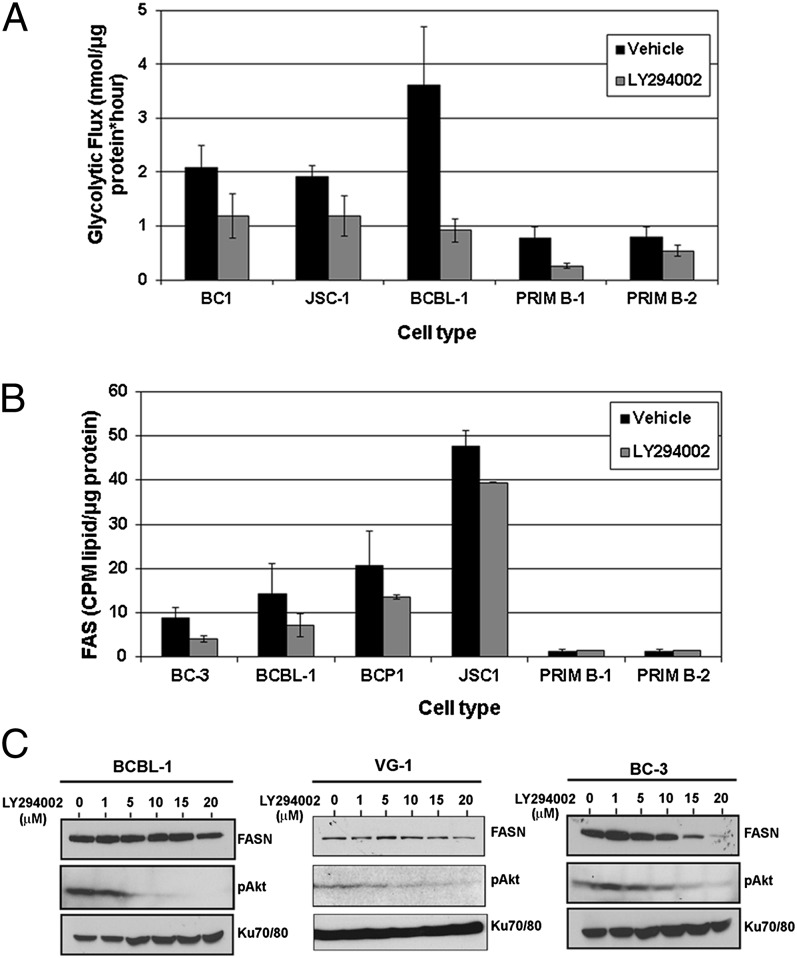
The metabolic differences between B-NHL and primary human B cells are poorly understood. Among human B-cell non-Hodgkin lymphomas (B-NHL), primary effusion lymphoma (PEL) is a unique subset that is linked to infection with Kaposi's sarcoma-associated herpesvirus (KSHV). We report that the metabolic profiles of primary B cells are significantly different from that of PEL. Compared with primary B cells, both aerobic glycolysis and fatty acid synthesis (FAS) are up-regulated in PEL and other types of nonviral B-NHL. We found that aerobic glycolysis and FAS occur in a PI3K-dependent manner and appear to be interdependent. PEL overexpress the fatty acid synthesizing enzyme, FASN, and both PEL and other B-NHL were much more sensitive to the FAS inhibitor, C75, than primary B cells. Our findings suggest that FASN may be a unique candidate for molecular targeted therapy against PEL and other B-NHL.


Conflict of interest statement

The authors declare no conflict of interest.

Figures

Fig. 1.
Fig. 1.
Glycolysis and FAS pathways. (A) Once glucose (Glc) enters the cell through transporters such as GLUT1, hexokinase rapidly phosphorylates Glc into Glc-6-phosphate, which participates in glycolysis to generate 2 ATP. Pyruvate, the end product of glycolysis, is converted into lactate by lactate dehydrogenase and is secreted through monocarboxylate transporters (for e.g., MCT1). Alternatively, pyruvate can be further oxidized in the mitochondrion via the Krebs cycle to yield 36 ATP per molecule of Glc. Citrate, an intermediate metabolite, can exit the Krebs cycle and be transported into the cytoplasm, where it can be broken down into acetyl-CoA. Acetyl-CoA is converted into malonyl-CoA by acetyl-CoA carboxylase, which is the commitment step of FAS. Acetyl- and malonyl-CoA, in a series of reactions, are combined by FASN, a multienzyme polypeptide, to yield palmitate (C16), which is then elongated or desaturated into other fatty acids. These fatty acids can be used to further synthesize other macromolecules and lipids necessary for dividing cells. (B) BCP-1, a representative PEL, is sensitive to Glc deprivation from growth medium, which normally has 2 mM glucose. Reduction of Glc concentration in growth medium increases the percentage of dead cells, as visualized by trypan blue exclusion (Left) and reduces BCP-1 proliferation as determined by MTS assay (Right). (C) BCBL-1, another representative PEL, is susceptible to 2DG in a dose-dependent manner. Error bars are ± SEM, and data are representative of multiple independent experiments.
Fig. 2.
Fig. 2.
PEL up-regulate glycolysis. The protein-normalized relative intensities (“scaled intensities”) of intra- and extracellular concentrations of glycolytic intermediates, represented as box and whisker plots, are significantly different between PEL and primary B cells. Data are the combined average of six different primary B cells derived from six healthy donors and six PEL lines. (A) Intracellular levels of free Glc are lower, whereas that of lactate are higher in PEL, compared with primary B cells. (B) The spent media of PEL contains lower concentration of Glc and increased levels of lactate and pyruvate compared with the spent media of primary B cells. (C) Equal numbers of PEL and primary cells were cultured for 24 h, and glycolytic flux was measured. PEL cells exhibit significantly increased (P = 0.000000026) glycolysis compared with primary human B cells. (D) Equal numbers of PEL, BL (CA46), FL (K422 and SUDHL4), and primary B cells were cultured for 24 h, and glycolytic flux was measured. All B-NHL have significantly (P = 0.000627) higher glycolytic flux compared with primary B cells. Data are normalized to total input protein. Error bars are ± SEM; data are one representative of more than five independent experiments.
Fig. 3.
Fig. 3.
FAS is a critical and essential metabolic pathway for the proliferation of PEL. (A) PEL express higher levels of FASN compared with primary B cells. Ku80 is shown as a loading control. (B) The rate of FAS in PEL is significantly higher (P = 0.012) compared with primary B cells. (C) PEL (BC-1 and BCBL-1) have higher FAS rates compared with BL (CA46) and FL (K422 and SUDHL4). Collectively, all B-NHL have a higher FAS rate compared with primary B cells. Data are normalized to total input protein and is one representative of multiple independent experiments. Error bars are ± SEM. (D) Inhibition of FAS using varying concentrations of the FASN inhibitor, C75, leads to a dose-dependent increase in cell death in BC-1 (Left) and BC-3 (Right) PEL cells, as measured by trypan blue exclusion. (E) Inhibition of FAS using C75 leads to minimal cell death in primary B cells from two donors, as measured by trypan blue exclusion. Error bars are ± SEM.
Fig. 4.
Fig. 4.
LPS-driven proliferation of primary B cells is not linked to the rate of FAS as is evident in untreated PEL. (A) Stimulation of primary B cells with 10 μg/mL LPS leads to an increase in proliferation as measured by MTS assay. (B) Glycolysis is minimally up-regulated in LPS-stimulated proliferating primary B cells, but the rates are significantly lower (*P ≤ 0.05) than those of vehicle-treated PEL. (C) FAS is not up-regulated in LPS-stimulated primary B cells and the rates of FAS are significantly lower (*P ≤ 0.01) than those seen in untreated PEL. Error bars are ± SEM. (D) There is a slight increase in FASN expression in LPS-stimulated proliferating primary B cells, but these levels are 5 times lower than that seen in untreated PEL (quantified using densitometry). Ku80 is a loading control.
Fig. 5.
Fig. 5.
Glycolysis and FAS are intimately linked in B-NHL. (A) PEL and primary B cells treated for 72 h with 10 μg/mL C75 show a significant decrease in glycolysis (P ≤ 0.05 for all comparisons), similar to 1 mM 2DG-treated cells (positive control). Error bars are ± SEM. (B) PEL cells treated for 72 h with 1 mM 2DG have decreased FAS (P ≤ 0.05), and with 10 μg/mL C75 (positive control) have significantly decreased FAS (P ≤ 0.05). Primary B cells display minimal FAS activity, which is not down-regulated with inhibitors. Error bars are ± SEM; data are representative of more than three independent experiments. (C) B-NHL (including PEL), LCL, and primary B cells treated for 72 h with 10 μg/mL C75 show a reduction in glycolysis comparable with 2DG-treated cells. (D) Glycolysis inhibition of B-NHL (including PEL) and LCL with 2DG substantially reduces FAS to a rate similar to the FASN inhibitor C75, but does not impact FAS in primary B cells. (E and F) A dendrogram of hierarchical clustering (E) and principal component analysis (F) of relative intensities of metabolic intermediates of glycolysis and FAS demonstrates that PEL and primary B cells display distinct metabolic profiles.
Fig. 6.
Fig. 6.
PI3K inhibition decreases FAS and glycolysis in PEL cells. (A) Treatment of cells for 72 h with a noncytotoxic dose (1 μM) of LY294002 reduces the rate of glycolysis in both PEL (P ≤ 0.01) and primary B cells (P ≤ 0.01). Error bars are ± SEM. (B) LY294002 treatment significantly reduces FAS in PEL (P ≤ 0.01) but does not alter the already low rate of FAS in primary B cells. Error bars are ± SEM. (C) Treatment with LY294002 leads to a dose-dependent decrease in expression of FASN in BCBL-1 (Left), BC-3 (Right), and VG-1 (Center) PEL cells, with a concurrent decrease in pAKT.

References

    1. Boulanger E, et al. Prognostic factors and outcome of human herpesvirus 8-associated primary effusion lymphoma in patients with AIDS. J Clin Oncol. 2005;23:4372–4380. - PubMed
    1. Sin SH, et al. Rapamycin is efficacious against primary effusion lymphoma (PEL) cell lines in vivo by inhibiting autocrine signaling. Blood. 2007;109:2165–2173. - PMC - PubMed
    1. Bhatt AP, et al. Dual inhibition of PI3K and mTOR inhibits autocrine and paracrine proliferative loops in PI3K/Akt/mTOR-addicted lymphomas. Blood. 2010;115:4455–4463. - PMC - PubMed
    1. Wang L, et al. The Kaposi’s sarcoma-associated herpesvirus (KSHV/HHV-8) K1 protein induces expression of angiogenic and invasion factors. Cancer Res. 2004;64:2774–2781. - PubMed
    1. Tomlinson CC, Damania B. The K1 protein of Kaposi’s sarcoma-associated herpesvirus activates the Akt signaling pathway. J Virol. 2004;78:1918–1927. - PMC - PubMed

Publication types

MeSH terms