. 2012 Oct 1;21(19):4237-52.
doi: 10.1093/hmg/dds247. Epub 2012 Jul 2.

Activation of the stress proteome as a mechanism for small molecule therapeutics

Affiliations

Activation of the stress proteome as a mechanism for small molecule therapeutics

Rebecca Deering Brose et al. Hum Mol Genet. .

Abstract

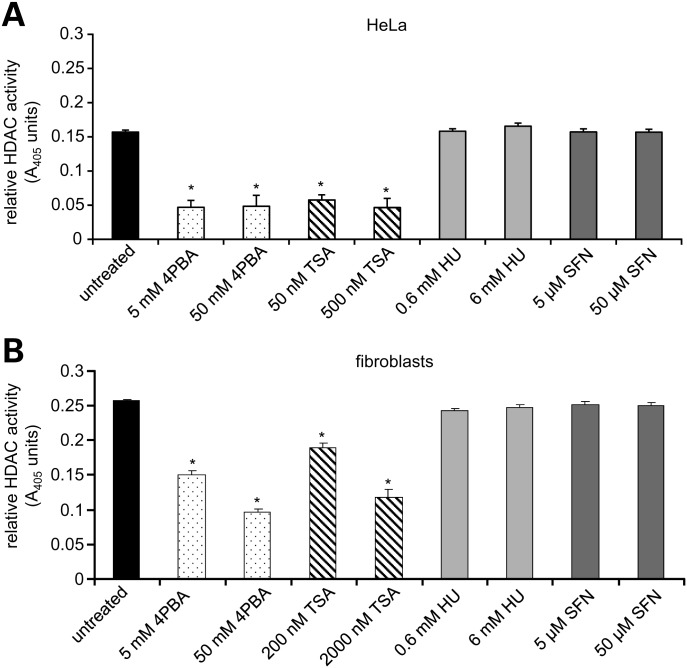
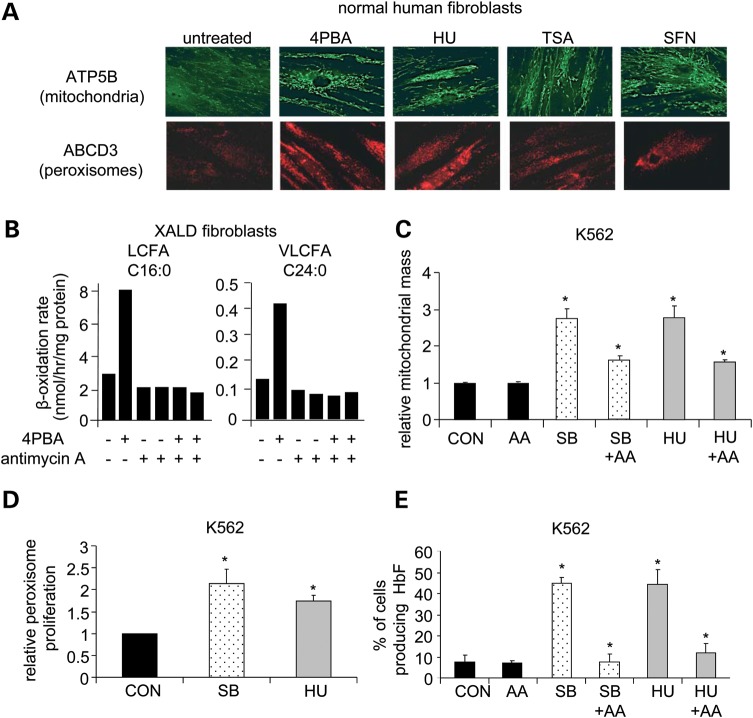
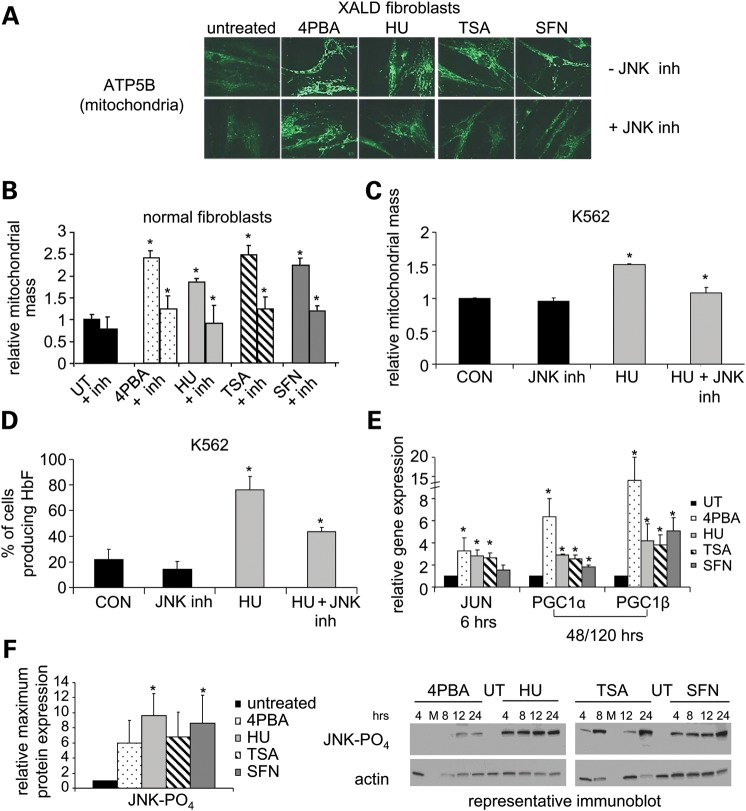
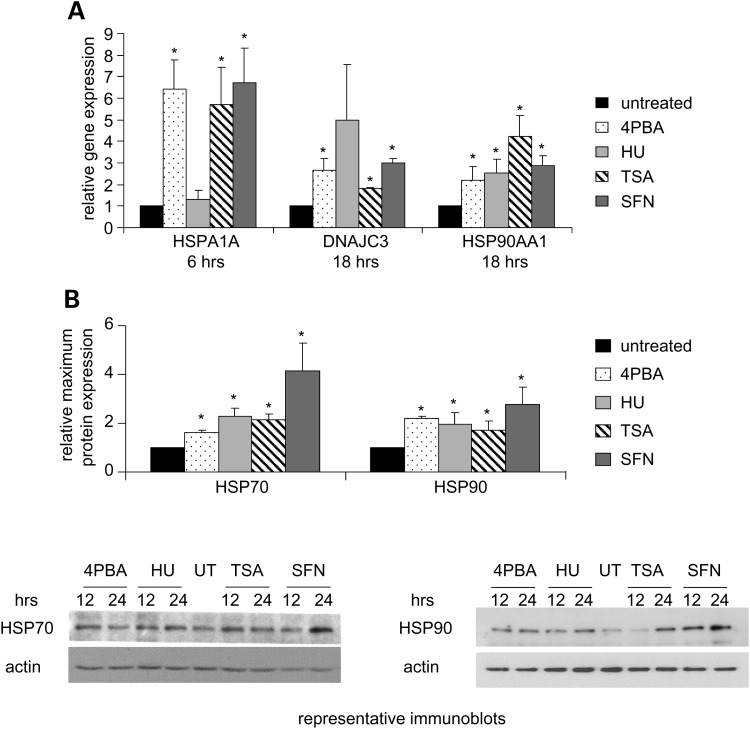
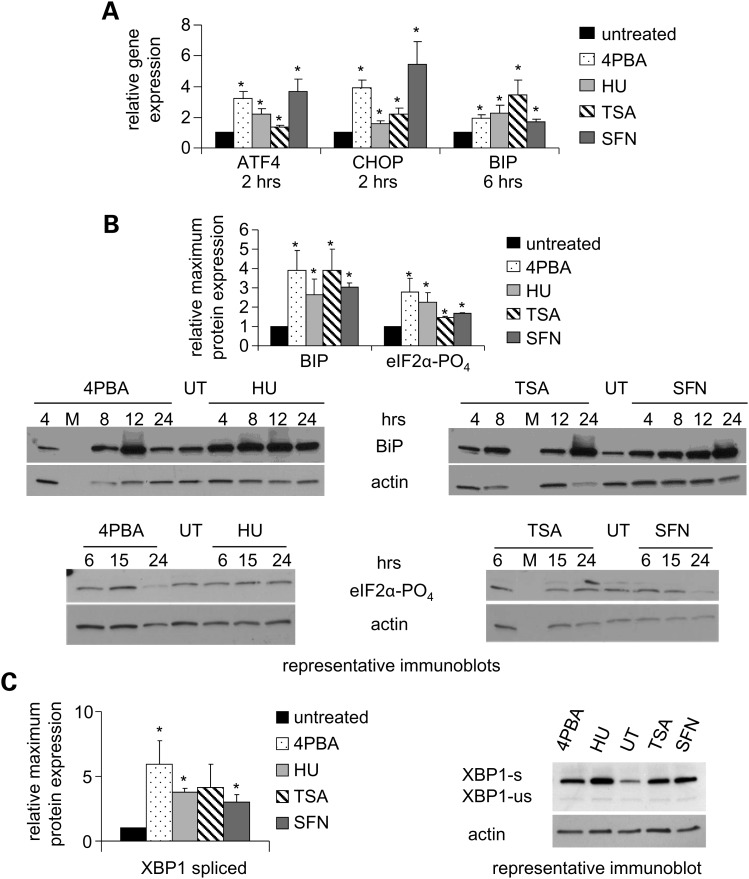
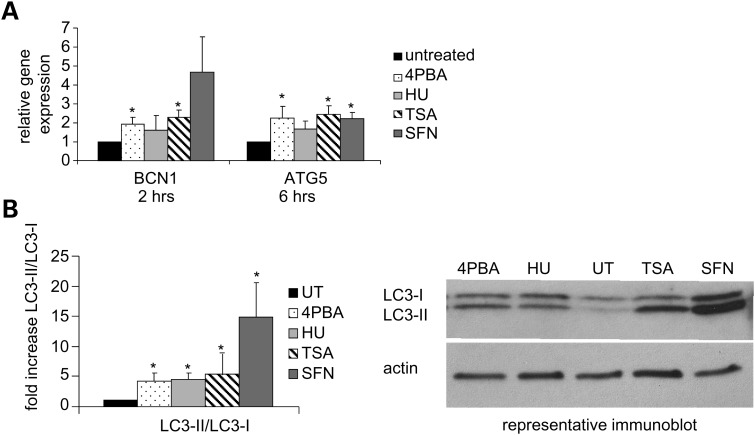
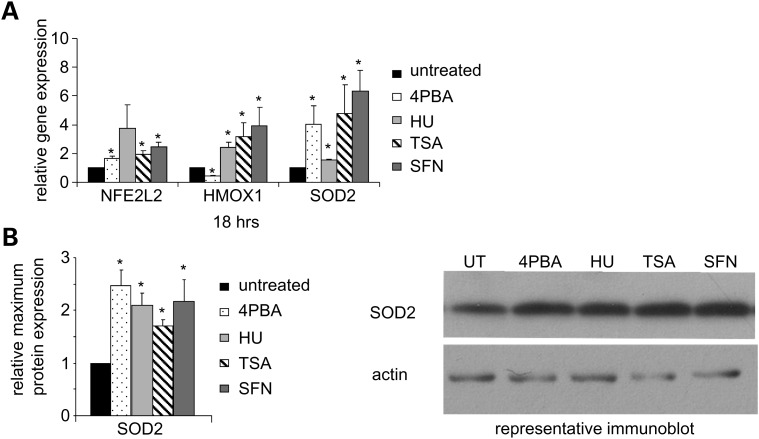
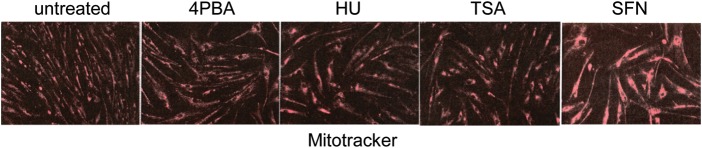
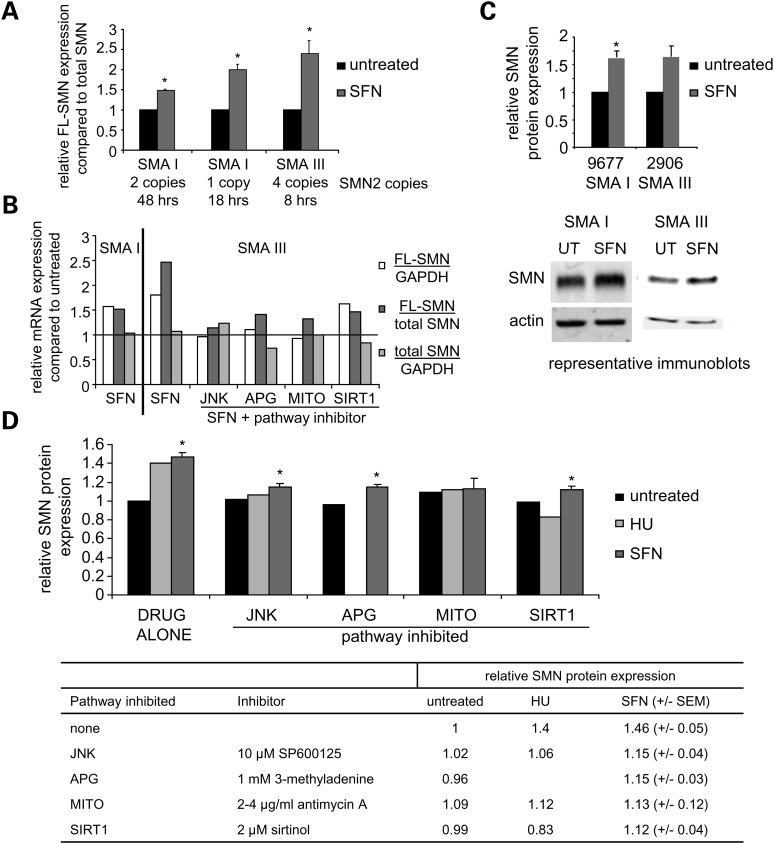
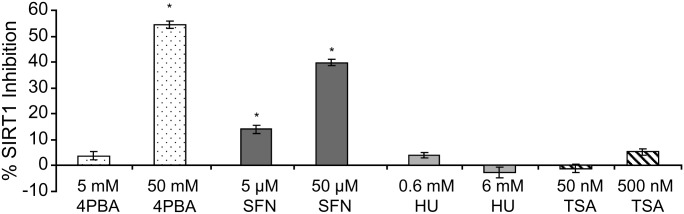
Various small molecule pharmacologic agents with different known functions produce similar outcomes in diverse Mendelian and complex disorders, suggesting that they may induce common cellular effects. These molecules include histone deacetylase inhibitors, 4-phenylbutyrate (4PBA) and trichostatin A, and two small molecules without direct histone deacetylase inhibitor activity, hydroxyurea (HU) and sulforaphane. In some cases, the therapeutic effects of histone deacetylase inhibitors have been attributed to an increase in expression of genes related to the disease-causing gene. However, here we show that the pharmacological induction of mitochondrial biogenesis was necessary for the potentially therapeutic effects of 4PBA or HU in two distinct disease models, X-linked adrenoleukodystrophy and sickle cell disease. We hypothesized that a common cellular response to these four molecules is induction of mitochondrial biogenesis and peroxisome proliferation and activation of the stress proteome, or adaptive cell survival response. Treatment of human fibroblasts with these four agents induced mitochondrial and peroxisomal biogenesis as monitored by flow cytometry, immunofluorescence and/or western analyses. In treated normal human fibroblasts, all four agents induced the adaptive cell survival response: heat shock, unfolded protein, autophagic and antioxidant responses and the c-jun N-terminal kinase pathway, at the transcriptional and translational levels. Thus, activation of the evolutionarily conserved stress proteome and mitochondrial biogenesis may be a common cellular response to such small molecule therapy and a common basis of therapeutic action in various diseases. Modulation of this novel therapeutic target could broaden the range of treatable diseases without directly targeting the causative genetic abnormalities.


Figures

Figure 1.
Figure 1.
HU and SFN do not inhibit class I and class II histone deacetylase (HDAC) activities. HDAC activity was measured by an in vitro colorimetric assay using whole cell extracts from HeLa cells or normal human fibroblasts. A decrease in A405 correlates with a reduction in HDAC activity. *P ≤ 0.00009; paired t-test. Bars = SEM for n ≥ 3 independent experiments performed in triplicate.
Figure 2.
Figure 2.
Pharmacological induction of mitochondrial function is necessary for beneficial responses in X-linked adrenoleukodystrophy and K562 cells. (A) Immunofluorescence staining for mitochondrial membrane protein ATP5B (top) and the peroxisomal membrane protein ABCD3 (bottom). Normal human fibroblasts were treated with each drug for 5 days and cells from the same treated cell population stained with either anti-ATP5B or anti-ABCD3. An increase in fluorescence indicates an increase in mitochondrial mass or peroxisome proliferation, respectively. ×400 magnification. In-cell western quantitation of induced mitochondrial biogenesis in normal human fibroblasts is shown in Figure 3B. (B) Very long-chain fatty acid analysis. X-linked adrenoleukodystrophy fibroblasts were treated with 4PBA in the presence or absence of antimycin A (AA), a cytochrome c reductase inhibitor, for 5 days and β-oxidation levels of long-chain fatty acid (LCFA; C16:0) and very long-chain fatty acid (VLCFA; C24:0) levels were measured in duplicate. (CE) K562 cells were treated with SB, HU or PBS as a control (CON) in the presence or absence of antimycin A (AA). N ≥ 3 unless otherwise noted. (C) Flow cytometric analysis of mitochondrial mass. After 2–4 days of drug treatment, mitochondria were stained with Mitotracker, a mitochondrion-selective dye, and mitochondrial mass measured by flow cytometry. The fold change (drug treated/control) in mitochondrial mass is shown. (D) Flow cytometric analysis of peroxisome proliferation. After 8–10 days of drug treatment, peroxisome proliferation was measured by flow cytometry using an antibody against the peroxisomal membrane protein PEX14 and a FITC-labeled secondary antibody. The fold change (drug treated/control) in peroxisome staining is shown. (E) Analysis of HbF-producing cell production. After 4 days of drug treatment, cells were stained with 2,7-diaminofluorene (DAF) to measure HbF content. The percent of cells producing HbF (DAF-stained cells) is plotted. *A statistically significant increase in a measurement between drug-treated and control samples or a statistically significant decrease in a measurement between drug-treated and drug-treated samples in the presence of AA (P ≤ 0.05). Bars = SEM.
Figure 3.
Figure 3.
Mitochondrial biogenesis induced by 4PBA, HU, TSA or SFN is JNK-dependent. (AD) JNK inhibitor SP600125 (10 μm). (A) Immunofluorescence staining for mitochondrial membrane protein ATP5B. X-linked adrenoleukodystrophy (XALD) fibroblasts were treated with each drug for 4 days with (top row; -JNK inh) or without SP600125 (bottom row; +JNK inh). ×400 magnification. (B) Quantitation of pharmacological induction of mitochondrial biogenesis. Normal human fibroblasts were treated with each drug with (+ inh) or without SP600125 for 6 days. Mitochondrial mass was quantitated via in-cell western analyses using anti-ATP5B staining, a mitochondrial membrane marker. Untreated values were normalized to 1 and the relative mitochondrial mass plotted. Mitochondrial mass significantly increased 2.4-fold, 1.8-fold, 2.5-fold and 2.2-fold with 4PBA, HU, TSA or SFN treatment, respectively, compared with untreated cells. (C and D) JNK inhibition of mitochondrial biogenesis and HbF-containing cell production. K562 cells were treated for 4 days with HU in the presence (+ inh) or absence of SP600125 or PBS as a control (CON). (C) Mitochondrial mass (plotted as in Fig. 1C) and (D) the percent of cells producing HbF were determined by staining with Mitotracker and DAF, respectively (n = 2). (E) mRNA expression of JUN and mitochondrial transcription factors PGC1α and PGC1β by RT-PCR. The relative gene expression for each treatment compared with untreated normal human fibroblasts was calculated and the fold change (drug treated/untreated) is shown. Untreated values were normalized to 1. Measurements of PGC1α and PGC1β levels represent the average of two or more measurements after 5 days and one treatment after 48 h of treatment. Measurements of PGC1α and PGC1β after SFN treatment were performed twice in duplicate. (F) Immunoblot analysis of JNK phosphorylation (46 kDa). Treatment of normal human fibroblasts was initiated at the indicated times prior to cell collection. The mean of the maximum protein expression observed within a 24 h treatment interval for three or more independent experiments is shown as fold change (drug treated/untreated). Actin (43 kDa) was the loading control. M denotes the marker lane. 0.05 ≤ P ≤ 0.10 for 4PBA and TSA treated samples. *Statistically significant increase in a measurement between drug treated and untreated or control samples or a statistically significant decrease in a measurement between drug-treated and drug-treated samples in the presence of SP600125 (P ≤ 0.05). N ≥ 3 independent experiments unless otherwise noted. Bars = SEM. See also Supplementary Material, Table S1.
Figure 4.
Figure 4.
The HSR is induced by 4PBA, HU, TSA or SFN treatment. (A) RT-PCR analyses of mRNA expression of HSR genes. Normal human fibroblasts were treated and the mRNA expression of HSPA1A (HSP70), DNAJC3 (HSP40) and HSP90AA1 (HSP90) was measured and plotted as in Figure 2E. The P-value for the SFN DNAJC3 measurements is 0.10. (B) Immunoblot analyses of HSP expression. Normal human fibroblasts were treated at various time points and stained with antibodies that detect all HSP70 or all HSP90 family members. The mean of the maximum protein expression observed within a 24 h treatment interval for three or more independent experiments was calculated. The fold change (drug treated/untreated) is plotted for total HSP70 (70 kDa) and total HSP90 (90 kDa) protein levels. Actin (43 kDa) was used as a loading control. UT, untreated cells. *Statistical significance (P ≤ 0.05). Bars = SEM for n ≥ 3 independent experiments.
Figure 5.
Figure 5.
The UPR is activated by 4PBA, HU, TSA or SFN treatment. (A) RT-PCR analyses of mRNA expression of UPR genes. Normal human fibroblasts were treated with each drug as indicated. The expression of the UPR genes ATF4, CHOP and BIP was measured as described in Figure 2E. (B) Immunoblot analyses of UPR protein expression. Normal human fibroblasts were treated at various time points. The maximum protein expression observed within a 24 h interval was determined; and the mean of three or more independent experiments plotted as fold change (drug treated/untreated) for BIP (78 kDa) and phosphorylated eIF2α (38 kDa). Actin (43 kDa) was used as a loading control and is the same blot as Figure 2F. UT denotes untreated cells. M denotes marker lane. (C) XBP1 splicing. Normal human fibroblasts were treated. The expression of the unactivated/unspliced form (XBP1-us; 33 kDa) and the activated/spliced form of XBP1 (XBP1-s; 54 kDa) was analyzed by immunoblotting. XBP1-s is a larger protein than XBP1-us due to non-canonical mRNA splicing which results in a larger carboxy-terminal domain. The percentage of XBP1-s to XBP1-us increased with each treatment as shown (24 h time point). The mean of the maximum expression of XBP1-s within a 24 h treatment interval is plotted as in Figure 5B. Actin was used as a loading control. P = 0.08 for the TSA treated values. *Statistical significance (P ≤ 0.05). Bars = SEM for n ≥ 3 independent experiments.
Figure 6.
Figure 6.
Autophagy is induced by 4PBA, HU, TSA or SFN treatment. (A) RT-PCR analyses of mRNA expression of autophagy genes. Normal human fibroblasts were treated as indicated. The expression of BCN1 and ATG5 was measured as described in Figure 2E. ATG5 mRNA levels after TSA treatment were measured in two independent experiments in duplicate. The P-value for the ATG5 HU-treated samples is 0.10. The P-values for the BCN1 HU and SFN samples are 0.23 and 0.06, respectively. (B) Immunoblot analyses of the cleavage and lipidation of autophagy protein APG8. Upon activation of autophagy, the APG8 protein (LC3-I; 17 kDa) is cleaved and lipidated (LC3-II; 13 kDa). Normal human fibroblasts were treated and the mean of the maximal increase in the proportion of LC-II to LC3-I within a 24 h treatment interval for three or more independent experiments is plotted as fold change (drug treated/untreated). A representative immunoblot is shown (24 h time point). Actin (43 kDa) was used as a loading control. UT denotes untreated cells. *Statistical significance (P ≤ 0.05). Bars = SEM for n ≥ 3 independent experiments unless otherwise noted.
Figure 7.
Figure 7.
The antioxidant response is induced by 4PBA, HU, TSA or SFN treatment. (A) RT-PCR analyses of mRNA expression of antioxidant genes. Normal human fibroblasts were treated for 18 h. The expression of NFE2L2, HMOX1 and SOD2 was measured as described in Figure 2E. The P-value for the NFE2L2 HU measurements was 0.11. (B) Immunoblot analyses of SOD2 protein expression. Normal human fibroblasts were treated for 2 to 5 days. The mean of the relative expression of SOD2 (26 kDa) across three or more independent experiments is plotted for each treatment as fold change (drug treated/untreated). Actin (43 kDa) was used as a loading control. *Statistical significance (P ≤ 0.05). Bars = SEM for n ≥ 3 independent experiments.
Figure 8.
Figure 8.
Mitochondrial biogenesis is induced in spinal muscular atrophy fibroblasts by 4PBA, HU, TSA or SFN treatment. Immunofluorescence staining for mitochondria using Mitotracker Red CMXROS. Spinal muscular atrophy fibroblasts were treated with 2.5 mm 4PBA, 300 μm HU, 100 nm TSA or 2.5 μm SFN for 5 days. ×80 magnification.
Figure 9.
Figure 9.
The induction of FL-SMN mRNA expression and SMN protein expression by SFN is dependent on the JNK pathway, autophagy, mitochondrial biogenesis and SIRT1 activity. (A) RT-PCR analyses of FL-SMN mRNA expression compared with total SMN transcript expression. Type I and type III spinal muscular atrophy (SMA I or SMA III) fibroblasts were treated with SFN for the indicated times. The relative fold increase in the ratio of FL-SMN/total SMN transcripts compared with the untreated cell line (normalized to 1) is plotted. Cell lines from left to right are GM09677, GM00232 and 2906. N ≥ 2 independent experiments. (B) RT-PCR analyses of FL-SMN and total SMN mRNA expression. Spinal muscular atrophy fibroblasts were treated with 1.5 μm SFN alone for 51 h (SMA I, GM09677) or treated with 0.5 μm SFN for 8h (SMA III, 2906) with or without 12.5 µm SP600125 (JNK inhibitor), 2.5 mm 3-methyladenine (autophagy inhibitor, APG), 5 µg/ml antimycin A (mitochondrial inhibitor, MITO) or 3 µm sirtinol (SIRT1 inhibitor). The fold increases in FL-SMN expression compared with either GAPDH or total SMN expression and the fold increase in total SMN expression compared with GAPDH expression after SFN treatment is plotted. Untreated values were normalized to 1 and are indicated by the horizontal line. (n = 1 per cell line, performed in duplicate) (C) Immunoblot analyses of SMN protein expression. Spinal muscular atrophy type I (SMA I; GM09677, n = 7) or type III (SMA III; 2906, n= 2) fibroblasts were treated with either 1.5 µm SFN or 0.5–2 µm SFN, respectively, for 48–72 h. The average of the relative expression of SMN protein (39 kDa) is plotted. Actin (43 kDa) was used as a loading control. (D) Summary of the effects of stress pathway inhibitors on SMN protein expression. Spinal muscular atrophy type I (SMA I; GM09677) fibroblasts were treated with either 300 μm HU (n = 1) or 1.5 μm SFN (n ≥ 3) in the presence or absence of 10 μm SP600125 (JNK inhibitor), 1 mm 3-methyladenine (APG inhibitor), 2–4 μg/ml antimycin A (MITO inhibitor) or 2 μm sirtinol (SIRT1 inhibitor) for 48 h. SMN protein expression was measured by quantitative immunoblot analyses using actin as a loading control. Fold increases in SMN protein expression are plotted and represented numerically in the table below the graph. Untreated values are normalized to 1. *P ≤ 0.05; bars = SEM.
Figure 10.
Figure 10.
Biochemical SIRT1 activation is not necessary for the induction of the stress proteome by 4PBA, HU, TSA and SFN. SIRT1 activity assay. SIRT1 activity was measured by incubating an acetylated lysine substrate with human recombinant SIRT1, cosubstrate NAD+ and the indicated concentration of each small molecule. The percent inhibition of SIRT1 is plotted. Bars = SEM for triplicate measurements. *P ≤ 0.05; paired t-test.

Similar articles

Cited by

References

    1. Kemp S., Wei H.M., Lu J.F., Braiterman L.T., McGuinness M.C., Moser A.B., Watkins P.A., Smith K.D. Gene redundancy and pharmacological gene therapy: implications for X-linked adrenoleukodystrophy. Nat. Med. 1998;4:1261–1268. - PubMed
    1. Gardian G., Browne S.E., Choi D.K., Klivenyi P., Gregorio J., Kubilus J.K., Ryu H., Langley B., Ratan R.R., Ferrante R.J., et al. Neuroprotective effects of phenylbutyrate in the N171-82Q transgenic mouse model of Huntington's disease. J. Biol. Chem. 2005;280:556–563. - PubMed
    1. McGuinness M.C., Lu J.F., Zhang H.P., Dong G.X., Heinzer A.K., Watkins P.A., Powers J., Smith K.D. Role of ALDP (ABCD1) and mitochondria in X-linked adrenoleukodystrophy. Mol. Cell. Biol. 2003;23:744–753. - PMC - PubMed
    1. McGuinness M.C., Zhang H.P., Smith K.D. Evaluation of pharmacological induction of fatty acid beta-oxidation in X-linked adrenoleukodystrophy. Mol. Genet. Metab. 2001;74:256–263. - PubMed
    1. Li X., Baumgart E., Dong G.X., Morrell J.C., Jimenez-Sanchez G., Valle D., Smith K.D., Gould S.J. PEX11alpha is required for peroxisome proliferation in response to 4-phenylbutyrate but is dispensable for peroxisome proliferator-activated receptor alpha-mediated peroxisome proliferation. Mol. Cell. Biol. 2002;22:8226–8240. - PMC - PubMed

Publication types