Friedreich ataxia clinical outcome measures: natural history evaluation in 410 participants
- PMID: 22752494
- PMCID: PMC3674496
- DOI: 10.1177/0883073812448462
Friedreich ataxia clinical outcome measures: natural history evaluation in 410 participants
Abstract
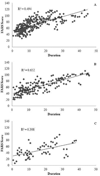
Friedreich ataxia is an autosomal recessive neurodegenerative disorder characterized by ataxia, dysarthria, and areflexia. The authors report the progress of a large international noninterventional cohort (n = 410), tracking the natural history of disease progression using the neurologic examination-based Friedreich Ataxia Rating Scale. The authors analyzed the rate of progression with cross-sectional analysis and longitudinal analysis over a 2-year period. The Friedreich Ataxia Rating Scale captured disease progression when used at 1 and 2 years following initial evaluation, with a lower ratio of standard deviation of change to mean change over 2 years of evaluation. However, modeling of disease progression identified substantial ceiling effects in the Friedreich Ataxia Rating Scale, suggesting this measure is most useful in subjects before maximal deficit is approached.
Figures


References
-
- Campuzano V, Montermini L, Molto MD, et al. Friedreich’s ataxia: Autosomal recessive disease caused by an intronic GAA triplet repeat expansion. Science. 1996;271:1423–1427. - PubMed
-
- Durr A, Cossee M, Agid Y, et al. Clinical and genetic abnormalities in patients with Friedreich’s ataxia. N Engl J Med. 1996;335:1169–1175. - PubMed
-
- Lynch DR. Measuring Friedreich ataxia: complementary features of examination and performance measures. Neurology. 2006;66:1711–1716. - PubMed
-
- Cossee M, Durr A, Schmitt M, et al. Friedreich’s ataxia: point mutations and clinical presentation of compound heterozygotes. Ann Neurol. 1999;45:200–206. - PubMed
Publication types
MeSH terms
Substances
Grants and funding
LinkOut - more resources
Full Text Sources
Other Literature Sources
Medical

