Increased bursting glutamatergic neurotransmission in an auditory forebrain area of the zebra finch (Taenopygia guttata) induced by auditory stimulation
- PMID: 22752655
- PMCID: PMC3437323
- DOI: 10.1007/s00359-012-0741-2
Increased bursting glutamatergic neurotransmission in an auditory forebrain area of the zebra finch (Taenopygia guttata) induced by auditory stimulation
Abstract
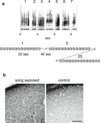
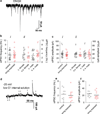
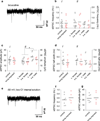
The caudomedial nidopallium (NCM) is a telencephalic area involved in auditory processing and memorization in songbirds, but the synaptic mechanisms associated with auditory processing in NCM are largely unknown. To identify potential changes in synaptic transmission induced by auditory stimulation in NCM, we used a slice preparation for path-clamp recordings of synaptic currents in the NCM of adult zebra finches (Taenopygia guttata) sacrificed after sound isolation followed by exposure to conspecific song or silence. Although post-synaptic GABAergic and glutamatergic currents in the NCM of control and song-exposed birds did not present any differences regarding their frequency, amplitude and duration after song exposure, we observed a higher probability of generation of bursting glutamatergic currents after blockade of GABAergic transmission in song-exposed birds as compared to controls. Both song-exposed males and females presented an increase in the probability of the expression of bursting glutamatergic currents, however bursting was more commonly seen in males where they appeared even without blocking GABAergic transmission. Our data show that song exposure changes the excitability of the glutamatergic neuronal network, increasing the probability of the generation of bursts of glutamatergic currents, but does not affect basic parameters of glutamatergic and GABAergic synaptic currents.
Figures


Similar articles
-
Early Auditory Experience Modifies Neuronal Firing Properties in the Zebra Finch Auditory Cortex.Front Neural Circuits. 2020 Oct 8;14:570174. doi: 10.3389/fncir.2020.570174. eCollection 2020. Front Neural Circuits. 2020. PMID: 33132855 Free PMC article.
-
ZENK induction in the zebra finch brain by song: Relationship to hemisphere, rhythm, oestradiol and sex.J Neuroendocrinol. 2017 Dec;29(12):10.1111/jne.12543. doi: 10.1111/jne.12543. J Neuroendocrinol. 2017. PMID: 28983985 Free PMC article.
-
The neural response of female zebra finches (Taeniopygia guttata) to conspecific, heterospecific, and isolate song depends on early-life song exposure.Behav Processes. 2019 Jun;163:37-44. doi: 10.1016/j.beproc.2017.12.022. Epub 2017 Dec 21. Behav Processes. 2019. PMID: 29274763
-
Functional magnetic resonance imaging in zebra finch discerns the neural substrate involved in segregation of conspecific song from background noise.J Neurophysiol. 2008 Feb;99(2):931-8. doi: 10.1152/jn.00483.2007. Epub 2007 Sep 19. J Neurophysiol. 2008. PMID: 17881485
-
Sensory Coding and Sensitivity to Local Estrogens Shift during Critical Period Milestones in the Auditory Cortex of Male Songbirds.eNeuro. 2017 Dec 12;4(6):ENEURO.0317-17.2017. doi: 10.1523/ENEURO.0317-17.2017. eCollection 2017 Nov-Dec. eNeuro. 2017. PMID: 29255797 Free PMC article.
Cited by
-
Control of Phasic Firing by a Background Leak Current in Avian Forebrain Auditory Neurons.Front Cell Neurosci. 2015 Dec 10;9:471. doi: 10.3389/fncel.2015.00471. eCollection 2015. Front Cell Neurosci. 2015. PMID: 26696830 Free PMC article.
-
A Membrane G-Protein-Coupled Estrogen Receptor Is Necessary but Not Sufficient for Sex Differences in Zebra Finch Auditory Coding.Endocrinology. 2018 Mar 1;159(3):1360-1376. doi: 10.1210/en.2017-03102. Endocrinology. 2018. PMID: 29351614 Free PMC article.
-
Early Auditory Experience Modifies Neuronal Firing Properties in the Zebra Finch Auditory Cortex.Front Neural Circuits. 2020 Oct 8;14:570174. doi: 10.3389/fncir.2020.570174. eCollection 2020. Front Neural Circuits. 2020. PMID: 33132855 Free PMC article.
References
-
- Bailey DJ, Wade J. FOS and ZENK responses in 45-day-old zebra finches vary with auditory stimulus and brain region, but not sex. Behav Brain Res. 2005;162:108–115. - PubMed
-
- Bolhuis JJ, Gahr M. Neural mechanisms of birdsong memory. Nat Rev Neurosci. 2006;7:347–357. - PubMed
-
- Brickley SG, Farrant M, Swanson GT, Cull-Candy SG. CNQX increases GABA-mediated synaptic transmission in the cerebellum by an AMPA/kainate receptor-independent mechanism. Neuropharmacology. 2001;41:730–736. - PubMed
-
- Catchpole CK, Slater PJB. Bird song: biological themes and variation. Cambridge: Cambridge University Press; 1995.
Publication types
MeSH terms
Substances
Grants and funding
LinkOut - more resources
Full Text Sources

