

Initial testing of the MDM2 inhibitor RG7112 by the Pediatric Preclinical Testing Program
- PMID: 22753001
- PMCID: PMC3495996
- DOI: 10.1002/pbc.24235
Initial testing of the MDM2 inhibitor RG7112 by the Pediatric Preclinical Testing Program
Abstract
Background: RG7112 is a selective inhibitor of p53-MDM2 binding that frees p53 from negative control, activating the p53 pathway in cancer cells leading to cell cycle arrest and apoptosis. RG7112 was selected for evaluation by the Pediatric Preclinical Testing Program (PPTP) due to the relatively low incidence of p53 mutations in pediatric cancers compared with adult malignancies.
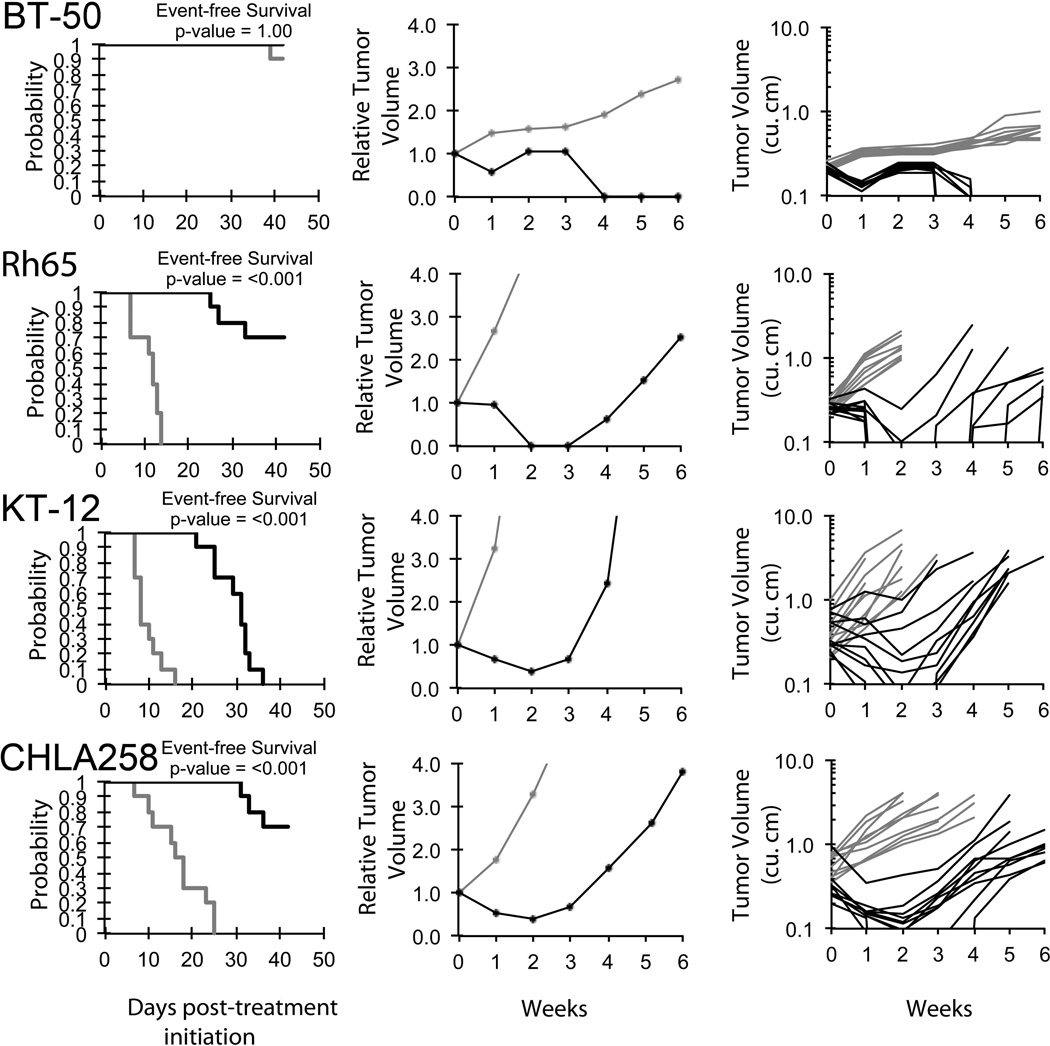
Procedures: RG7112 and its inactive enantiomer RG7112i were evaluated against the 23 cell lines of the PPTP in vitro panel using 96 hours exposure (1 nM to 10 µM). It was tested against the PPTP in vivo panel focusing on p53 wild-type (WT) xenografts at a dose of 100 mg/kg daily for 14 days followed by 4 weeks of observation. Response outcomes were related to MDM2 and p53 expression datasets (http://pptp.nchresearch.org/data.html).
Results: RG7112 demonstrated cytotoxic activity with a lower median IC(50) for p53 WT versus p53 mutant cell lines (approximately 0.4 µM vs. >10 µM, respectively). RG7112 induced tumor growth inhibition meeting criteria for intermediate activity (EFS T/C > 2) in 10 of 26 (38%) solid tumor xenografts. Objective responses included medulloblastoma, alveolar rhabdomyosarcoma, Wilms, rhabdoid and Ewing sarcoma xenografts. For the ALL panel, there was one partial response, five complete responses and one maintained complete response. The ALL xenografts expressed the highest levels of p53 among the PPTP panels.
Conclusions: RG7112 induced tumor regressions in solid tumors from different histotype panels, and exhibited consistent high-level activity against ALL xenografts. This high level of activity supports prioritization of RG7112 for further evaluation.
Copyright © 2012 Wiley Periodicals, Inc.
Conflict of interest statement
Figures


References
-
- Vousden KH, Lane DP. p53 in health and disease. Nat Rev Mol Cell Biol. 2007;8(4):275–283. - PubMed
-
- Levine AJ. p53, the Cellular Gatekeeper for Growth and Division. Cell. 1997;88(3):323–331. - PubMed
-
- Lane DP. p53, guardian of the genome. Nature. 1992;358(6381):15–16. - PubMed
-
- Hanahan D, Weinberg RA. Hallmarks of cancer: the next generation. Cell. 2011;144(5):646–674. - PubMed
-
- Royds JA, Iacopetta B. p53 and disease: when the guardian angel fails. Cell Death Differ. 2006;13(6):1017–1026. - PubMed
Publication types
MeSH terms
Substances
Grants and funding
LinkOut - more resources
Full Text Sources
Other Literature Sources
Research Materials
Miscellaneous
