

Defining the DNA uptake specificity of naturally competent Haemophilus influenzae cells
- PMID: 22753031
- PMCID: PMC3458573
- DOI: 10.1093/nar/gks640
Defining the DNA uptake specificity of naturally competent Haemophilus influenzae cells
Abstract
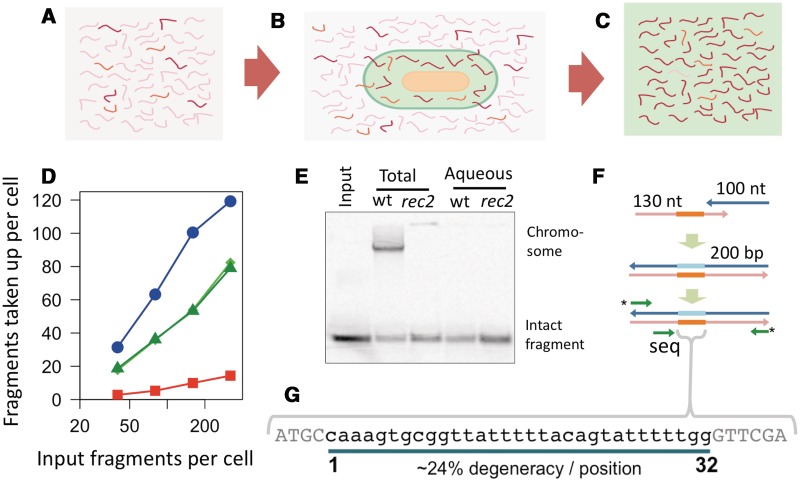
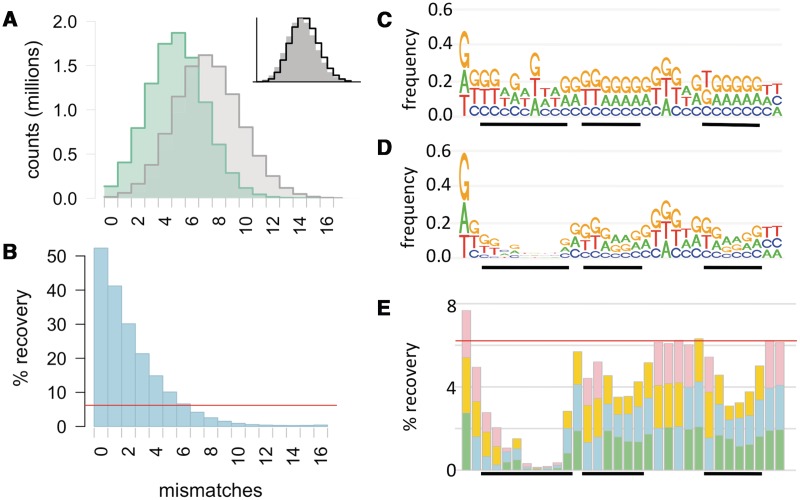
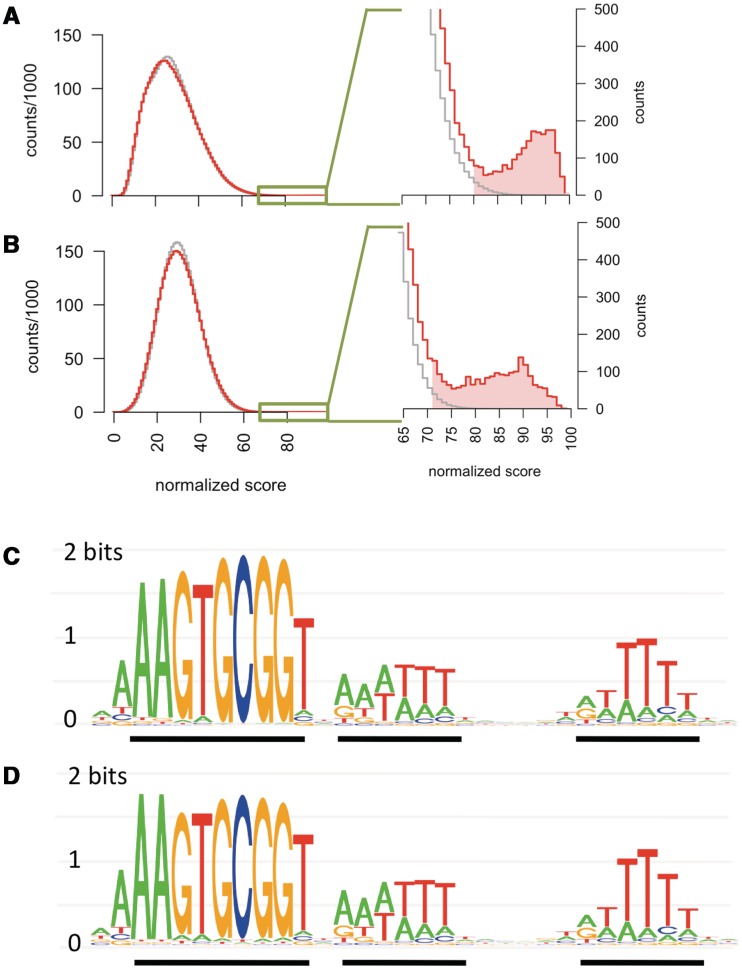
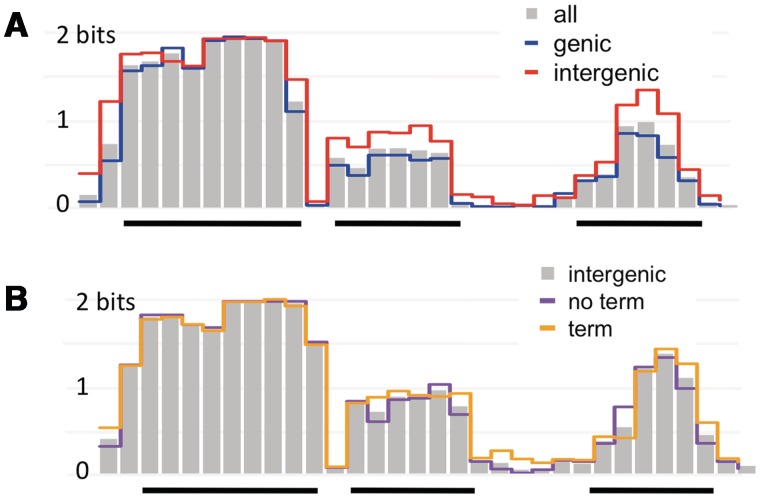
Some naturally competent bacteria exhibit both a strong preference for DNA fragments containing specific 'uptake sequences' and dramatic overrepresentation of these sequences in their genomes. Uptake sequences are often assumed to directly reflect the specificity of the DNA uptake machinery, but the actual specificity has not been well characterized for any bacterium. We produced a detailed analysis of Haemophilus influenzae's uptake specificity, using Illumina sequencing of degenerate uptake sequences in fragments recovered from competent cells. This identified an uptake motif with the same consensus as the motif overrepresented in the genome, with a 9 bp core (AAGTGCGGT) and two short flanking T-rich tracts. Only four core bases (GCGG) were critical for uptake, suggesting that these make strong specific contacts with the uptake machinery. Other core bases had weaker roles when considered individually, as did the T-tracts, but interaction effects between these were also determinants of uptake. The properties of genomic uptake sequences are also constrained by mutational biases and selective forces acting on USSs with coding and termination functions. Our findings define constraints on gene transfer by natural transformation and suggest how the DNA uptake machinery overcomes the physical constraints imposed by stiff highly charged DNA molecules.
Figures


Similar articles
-
Evolution of competence and DNA uptake specificity in the Pasteurellaceae.BMC Evol Biol. 2006 Oct 12;6:82. doi: 10.1186/1471-2148-6-82. BMC Evol Biol. 2006. PMID: 17038178 Free PMC article.
-
Genome dynamics of short oligonucleotides: the example of bacterial DNA uptake enhancing sequences.PLoS One. 2007 Aug 15;2(8):e741. doi: 10.1371/journal.pone.0000741. PLoS One. 2007. PMID: 17710141 Free PMC article.
-
Evolutionary stability of DNA uptake signal sequences in the Pasteurellaceae.Proc Natl Acad Sci U S A. 2004 Mar 30;101(13):4513-8. doi: 10.1073/pnas.0306366101. Epub 2004 Mar 19. Proc Natl Acad Sci U S A. 2004. PMID: 15070749 Free PMC article.
-
DNA uptake signal sequences in naturally transformable bacteria.Res Microbiol. 1999 Nov-Dec;150(9-10):603-16. doi: 10.1016/s0923-2508(99)00130-8. Res Microbiol. 1999. PMID: 10673000 Review.
-
Natural competence and the evolution of DNA uptake specificity.J Bacteriol. 2014 Apr;196(8):1471-83. doi: 10.1128/JB.01293-13. Epub 2014 Jan 31. J Bacteriol. 2014. PMID: 24488316 Free PMC article. Review.
Cited by
-
Role of Horizontal Gene Transfer in the Development of Multidrug Resistance in Haemophilus influenzae.mSphere. 2020 Jan 29;5(1):e00969-19. doi: 10.1128/mSphere.00969-19. mSphere. 2020. PMID: 31996416 Free PMC article.
-
Nutrient supplementation experiments with saltern microbial communities implicate utilization of DNA as a source of phosphorus.ISME J. 2021 Oct;15(10):2853-2864. doi: 10.1038/s41396-021-00960-8. Epub 2021 Apr 12. ISME J. 2021. PMID: 33846564 Free PMC article.
-
Genetic Adaptation and Acquisition of Macrolide Resistance in Haemophilus spp. during Persistent Respiratory Tract Colonization in Chronic Obstructive Pulmonary Disease (COPD) Patients Receiving Long-Term Azithromycin Treatment.Microbiol Spectr. 2023 Feb 14;11(1):e0386022. doi: 10.1128/spectrum.03860-22. Epub 2022 Dec 8. Microbiol Spectr. 2023. PMID: 36475849 Free PMC article.
-
How hyperthermophiles adapt to change their lives: DNA exchange in extreme conditions.Extremophiles. 2013 Jul;17(4):545-63. doi: 10.1007/s00792-013-0552-6. Epub 2013 May 28. Extremophiles. 2013. PMID: 23712907 Review.
-
Competence and natural transformation in vibrios.Mol Microbiol. 2013 Aug;89(4):583-95. doi: 10.1111/mmi.12307. Epub 2013 Jul 15. Mol Microbiol. 2013. PMID: 23803158 Free PMC article.
References
-
- Chen I, Dubnau D. DNA uptake during bacterial transformation. Nat. Rev. Microbiol. 2004;2:241–249. - PubMed
-
- Maughan H, Sinha S, Wilson L, Redfield RJ. In: Pasteurellaceae: Biology, Genomics and Molecular Aspects. Kuhnert P, Christensen H, editors. Norfolk, UK: Caister Academic Press; 2008.
-
- Smith HO, Gwinn ML, Salzberg SL. DNA uptake signal sequences in naturally transformable bacteria. Res. Microbiol. 1999;150:603–616. - PubMed
-
- Chu D, Lee HC, Lenaerts T. Evolution of DNA uptake signal sequences. Artif. Life. 2005;11:317–338. - PubMed
-
- Chu D, Rowe J, Lee HC. Evaluation of the current models for the evolution of bacterial DNA uptake signal sequences. J. Theor. Biol. 2006;238:157–166. - PubMed
